Let’s say you want to get an email notification when the free disk space on your server drops below some threshold level. There are many ways to go about this, but here is one that does not require you to install anything new on the system and is easy to audit (it’s a 4-line shell script).
The df Utility
df is a command-line program that reports file system disk space usage, and is usually preinstalled on Unix-like systems. Let’s run it:
$ df -h /
Filesystem                         Size  Used Avail Use% Mounted on
/dev/mapper/ubuntu--vg-ubuntu--lv   75G   23G   51G  32% /
The “-h” argument tells df to print sizes in human-readable units. The “/” argument tells df to only output stats about the root filesystem. The “Use%” field in the output indicates the root filesystem is 32% full. If we wanted to extract just the percentage, df has a handy “–output” argument:
$ df --output=pcent /
Use%
 32%
We can use tail to drop the first line, and tr to delete the space and percent-sign characters, leaving just the numeric value:
$ df --output=pcent / | tail -n 1 | tr -d '% '
32
The Disk Space Monitoring Script
Here is a shell script that looks up the free disk space on the root filesystem, compares it to a defined threshold value (75 in this example), then does some action depending on the result:
pct=$(df --output=pcent / | tail -n 1 | tr -d '% ')
if [ $pct -gt 75 ];
then
    // FIXME: the command to run when above the threshold
else
    // FIXME: the command to run when below the threshold
fi
We can save this as a shell script, and run it from cron at regular intervals. Except the script does not yet handle the alerting part of course. Some things to consider:
Rather than sending a notification after every check it would be much better to send a notification only when the available disk space crosses the threshold value.
Healthchecks.io
Healthchecks.io, a cron job monitoring service, can help with the alerting part:
You can send monitoring signals to Healthchecks.io via HTTP requests using curl or wget.
Healthchecks.io handles the email delivery (as well as Slack, Telegram, Pushover, and many other options).
Healthchecks.io sends notifications only on state changes – when something breaks or recovers. It will not spam you with ongoing reminders unless you tell it to.
It will also detect when your monitoring script goes AWOL. For example, when the whole system crashes or loses the network connection.
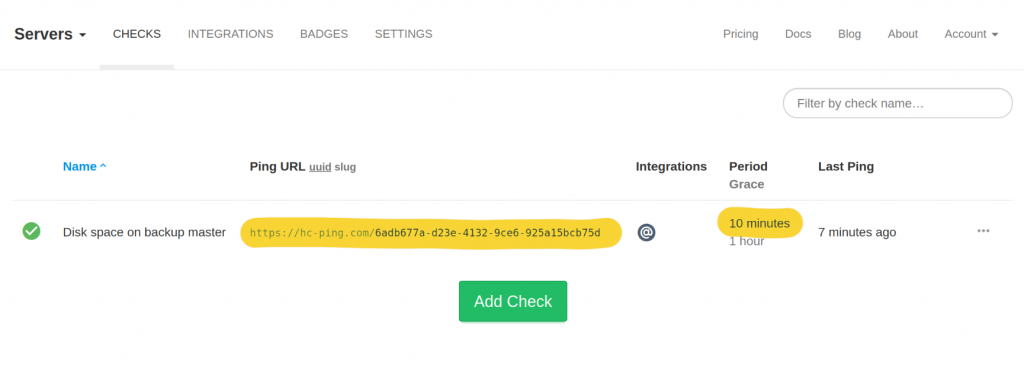
In your Healthchecks.io account, create a new Check, give it a descriptive name, set its Period to “10 minutes”, and copy its Ping URL.
The monitoring API is super-simple. To signal success (disk usage is below threshold), send an HTTP request to the Ping URL directly:
curl https://hc-ping.com/your-uuid-here
And, to signal failure, append “/fail” at the end of the Ping URL:
curl https://hc-ping.com/your-uuid-here/fail
Let’s integrate this into our monitoring script:
url=https://hc-ping.com/your-uuid-here
pct=$(df --output=pcent / | tail -n 1 | tr -d '% ')
if [ $pct -gt 75 ]; then url=$url/fail; fi
curl -fsS -m 10 --retry 5 -o /dev/null --data-raw "Used space on /: $pct%" $url
The curl call here has a few extra arguments:
“-fsS” tells curl to suppress output except for error messages
“-m 10” sets a 10-second timeout for HTTP requests
“–retry 5” tells curl to retry failed requests up to 5 times
“-o /dev/null” sends the server’s response to /dev/null
“–data-raw …” specifies a log message to include in an HTTP POST request body
Save this script in a convenient location, for example, in /opt/check-disk-space.sh, and make it executable. Then edit crontab (crontab -e) and add a new cron job:
*/10 * * * * /opt/check-disk-space.sh
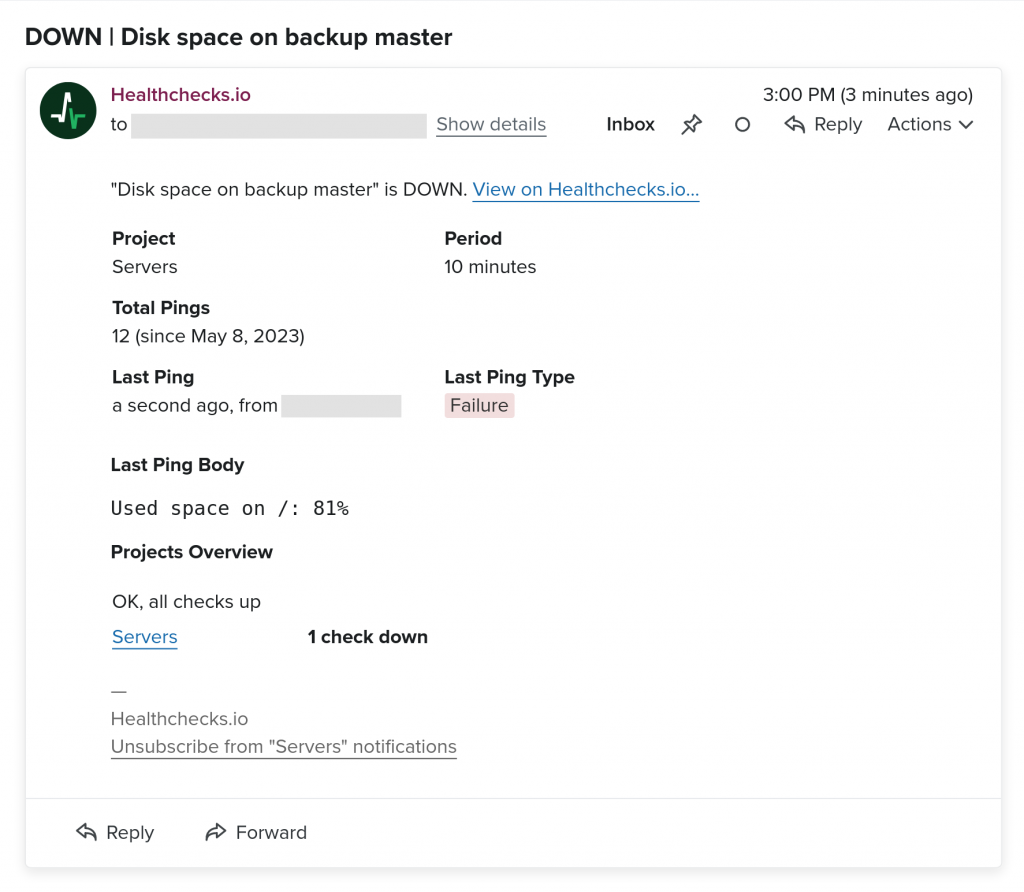
Cron will run the script every 10 minutes. On every run, the script will check the used disk space, and signal success (disk usage below or at threshold) or failure (disk usage above threshold) to Healthchecks.io. Whenever the status value flips, Healthchecks.io will send you a notification:
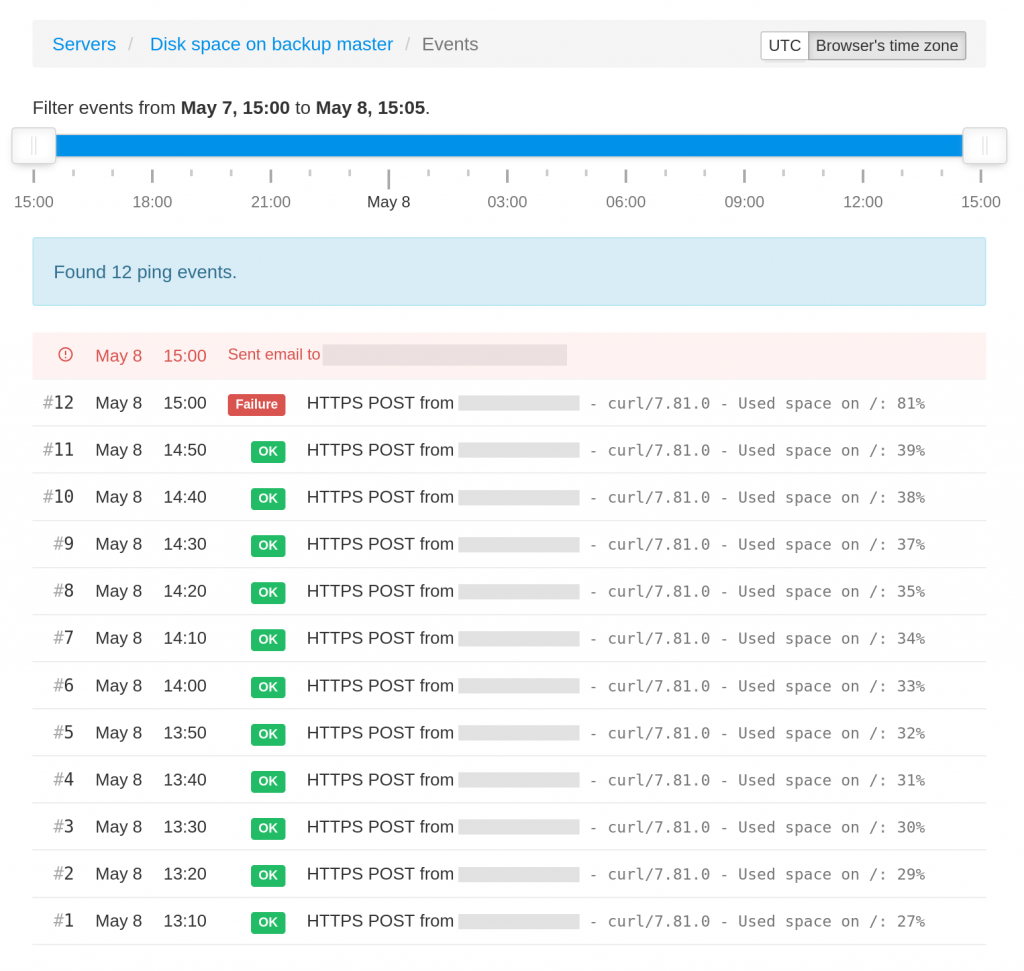
You will also see a log of the monitoring script’s check-ins in the Healthchecks.io web interface:
Closing Comments
If your use case involves handling millions of small files, at least on ext4 filesystems, the filesystem can also run out of inodes. Run df -i to see how many inodes are in use and how many are available. If inode use is a potential concern, you could update the check-disk-space.sh script to track it too.
The shell script + Healthchecks.io pattern would work for monitoring other system metrics too. For example, you could have a script that checks the system’s 15-minute load average, the number of files in a specific directory, or a temperature sensor’s reading.
If you are looking to monitor more than a couple of system metrics though, look into purpose-built system monitoring tools such as netdata. The shell script + Healthchecks.io approach works best when you have a few specific metrics you care about, and you want to avoid installing full-blown monitoring agents in your system.
Thanks for reading and happy monitoring, –Pēteris.
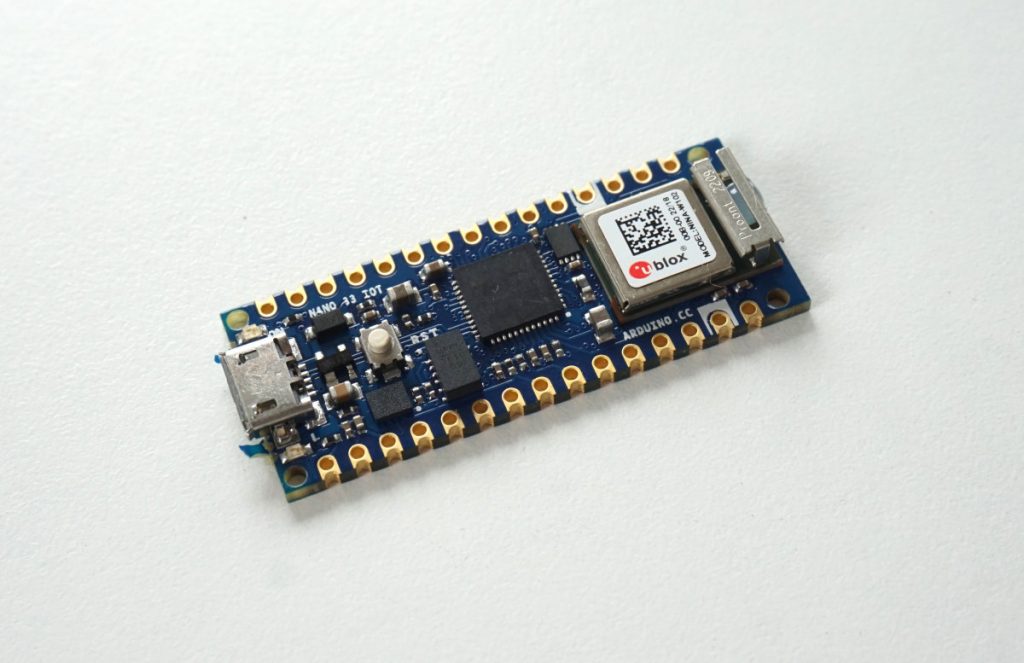
A Healthchecks user sent me a code snippet for sending HTTP pings from Arduino. This prompted me to do some Arduino experimenting on my own. I ordered Arduino Nano 33 IoT board:
Arduino Nano 33 IoT
I picked this board because I wanted an easy entry into Arduino development. As a first-party Arduino hardware, it should be easy to get it working with Arduino IDE. It has an on-board WIFI chip, so I would not need to hook up additional WiFi or Ethernet hardware.
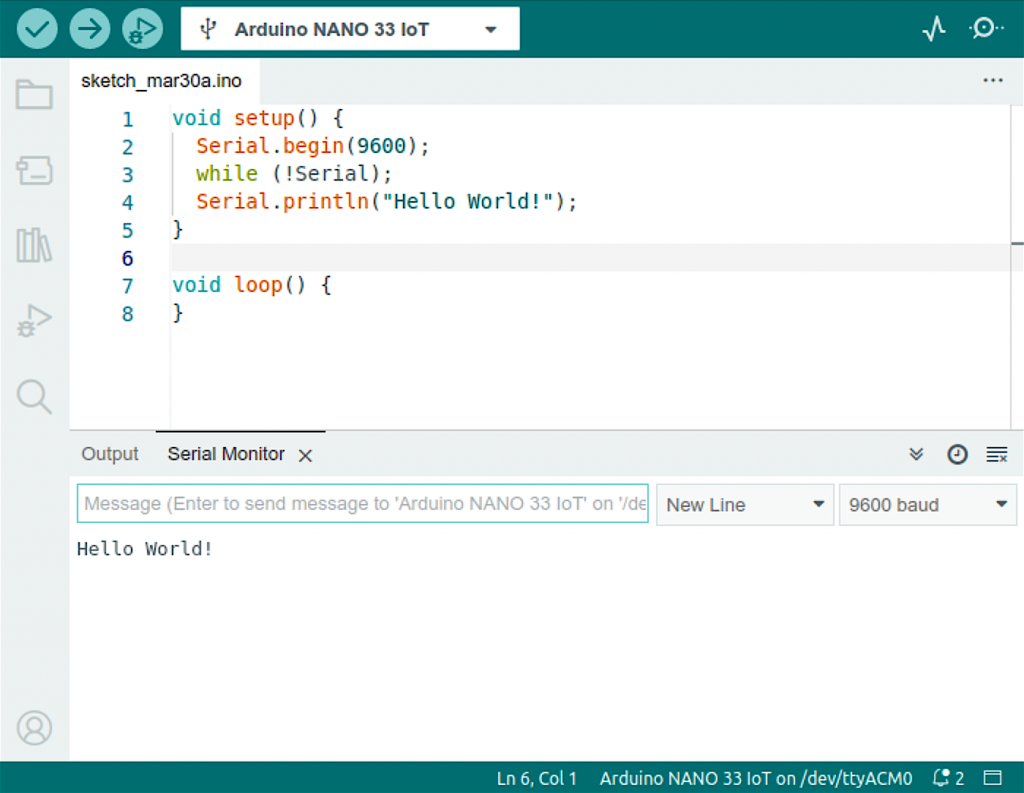
The Nano 33 IoT has a micro USB port. After connecting to my PC running Ubuntu, Arduino’s power LED lit up, and on the computer side a /dev/ttyACM0 device appeared. Arduino IDE detected the connected board, but my initial attempt to upload a sketch failed. This turned out to be a permissions issue. After I added my OS user to the dialout group, I could upload a “Hello World” sketch to the board:
Sending a Raw HTTP Request
Arduino Nano 33 IoT has an on-board WiFi module. To use it, Arduino provides the WiFiNINA library. The library comes with example code snippets. One of the examples shows how to connect to a WiFi network and make an HTTP request. I adapted it to make an HTTPS request to hc-ping.com:
#include <WiFiNINA.h>
#include "arduino_secrets.h"

char ssid[] = SECRET_SSID;
char pass[] = SECRET_PASS;
int status = WL_IDLE_STATUS;
WiFiSSLClient client;

void setup() {
  pinMode(LED_BUILTIN, OUTPUT);
  Serial.begin(9600);
  while (!Serial);

  Serial.print("Connecting ...");
  WiFi.begin(ssid, pass);
  while (WiFi.status() != WL_CONNECTED) {
    delay(500);
    Serial.print(".");
  }

  Serial.print("\nConnected, IP address: ");
  Serial.println(WiFi.localIP());
}

void ping() {
  Serial.println("Pinging hc-ping.com...");
  if (client.connect("hc-ping.com", 443)) {
    Serial.println("Connected to server.");
    client.println("GET /da840100-3f58-405e-a5ee-e7e6e4303e82 HTTP/1.0");
    client.println("Host: hc-ping.com");
    client.println("Connection: close");
    client.println();
    Serial.println("Request sent.");
  }

  while (client.connected()) {
    while (client.available()) {
      char c = client.read();
      Serial.write(c);
    }
  }
  Serial.println("\nClosing connection.");
  client.stop();
}

void loop() {
  ping();

  // Blink LED for 10 seconds:
  Serial.print("Waiting 10s: ");
  for (int i=0; i<10; i++) {
    Serial.print(".");
    digitalWrite(LED_BUILTIN, HIGH);
    delay(500);
    digitalWrite(LED_BUILTIN, LOW);
    delay(500);
  }
  Serial.println();
}
After uploading this sketch to Arduino, here’s the output on serial console:
Connecting ...
Connected, IP address: 192.168.1.77
Pinging hc-ping.com...
Connected to server.
Request sent.
HTTP/1.1 200 OK
server: nginx
date: Thu, 30 Mar 2023 12:33:25 GMT
content-type: text/plain; charset=utf-8
content-length: 2
access-control-allow-origin: *
ping-body-limit: 100000
connection: close

OK
Closing connection.
Waiting 10s: ..........
Pinging hc-ping.com...
Connected to server.
Request sent.
HTTP/1.1 200 OK
server: nginx
date: Thu, 30 Mar 2023 12:33:41 GMT
content-type: text/plain; charset=utf-8
content-length: 2
access-control-allow-origin: *
ping-body-limit: 100000
connection: close

OK
Closing connection.
Waiting 10s: .......
[...]
Quite impressively, this works over HTTPS out of the box – the WiFiNINA library and the chip takes care of performing TLS handshake and verifying the certificates. All I had to do was specify port 443, and the rest was handled automagically.
ArduinoHttpClient
After getting the minimal example working, I found the ArduinoHttpClient library. It offers a higher-level interface for making GET and POST requests, and for parsing server responses. It works with several different network libraries, including WifiNINA.
Connecting ...
Connected, IP address: 192.168.1.77
Status code: 200
Response: OK
Waiting 10s: ..........
Status code: 200
Response: OK
Waiting 10s: ..........
[...]
ESP8266
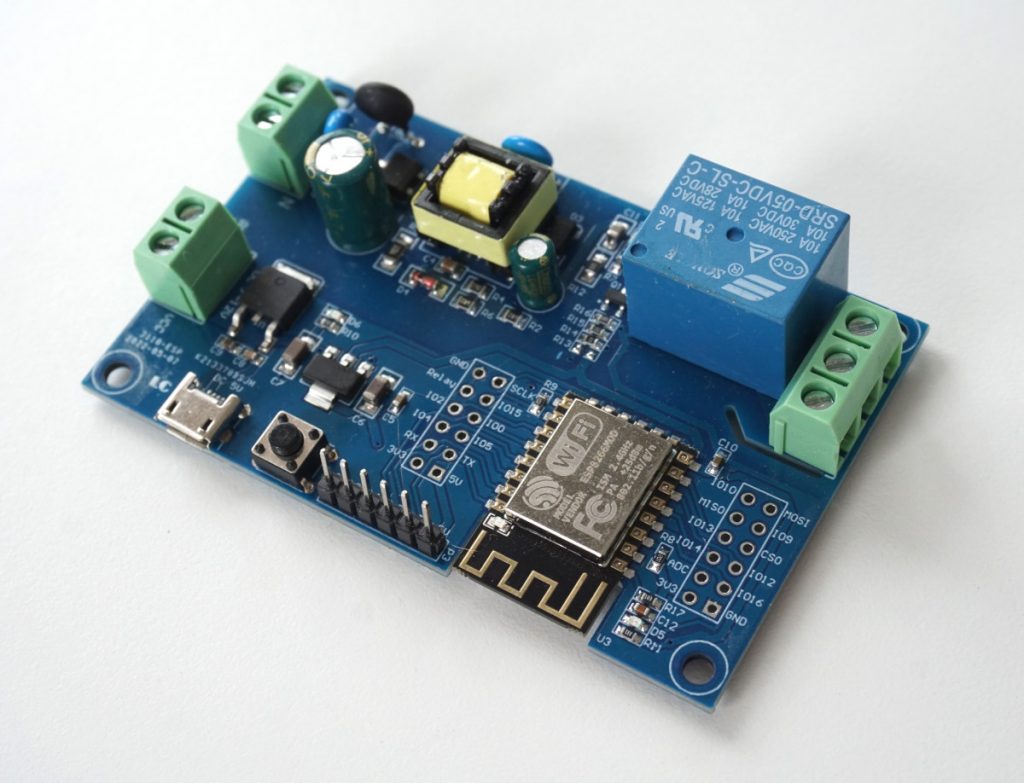
After having good results with Arduino Nano 33 IoT, I wanted to try the same on an ESP8266 board I had lying around:
ESP8266 on a carrier board
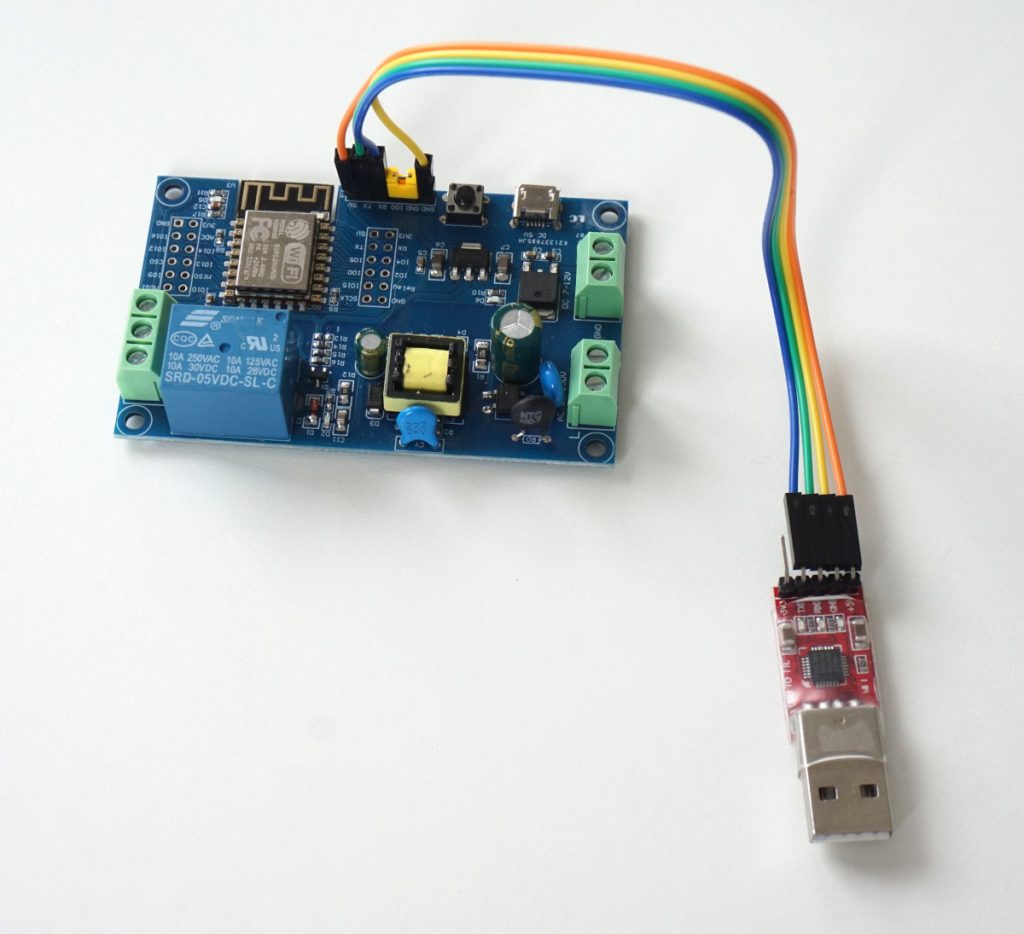
This board from AliExpress has a few goodies in addition to the ESP8266 chip: a relay, and multiple powering options: 220V AC, 7-12V DC, 5V DC. It has a USB port, but this port can be used for supplying power only, there is no USB-UART interface onboard. There are clearly labeled GND, 5V, RX, TX pins that I can hook a USB-UART converter (also from AliExpress) to:
ESP8266 with a USB-serial converter hooked up
The yellow jumper connects GPIO 0 to the ground, this puts ESP8266 in programming mode. At this point I can plug the USB-UART converter in the PC and check for signs of life using esptool:
$ apt-get install esptool
$ esptool chip_id
esptool.py v2.8
Found 2 serial ports
Serial port /dev/ttyUSB0
Connecting...
Detecting chip type... ESP8266
Chip is ESP8266EX
Features: WiFi
Crystal is 26MHz
MAC: a8:48:fa:ff:15:45
Enabling default SPI flash mode...
Chip ID: 0x00ff1545
Hard resetting via RTS pin...
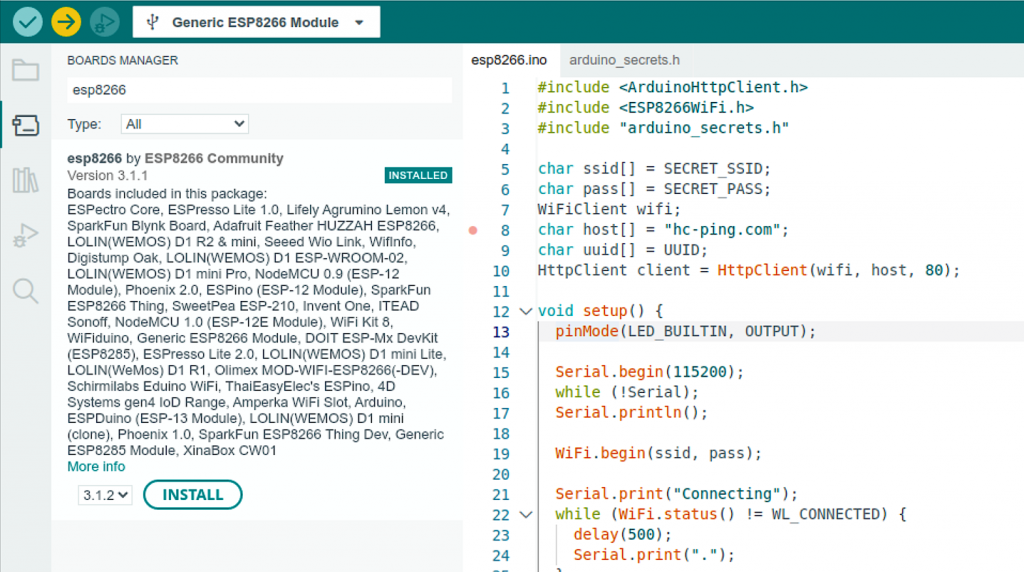
Arduino IDE does not support ESP8266 chips out of the box, but there is esp8266/Arduino project which adds support for different flavors of ESP boards.
esp8266 library in Arduino IDE’s Board Manager view
The esp8266/Arduino project also comes with a WiFi library, which provides an interface to the WiFi functionality on the chip. For simple use cases, the esp8266wifi library is a drop-in replacement for the WiFiNINA library:
Although the esp8266wifi library does support TLS, the documentation also mentions significant CPU and memory requirements. To keep things simple and quick, I went with port 80 and unencrypted HTTP for this experiment.
I uploaded the sketch, removed the yellow jumper, reset the board, and got this output on the serial console:
Connecting ..........
Connected, IP address: 192.168.1.78
Status code: 200
Response: OK
Waiting 10s: ..........
Status code: 200
Response: OK
Waiting 10s: ..........
[...]
Success!
In summary, my first steps in Arduino development left me with positive impressions. The network libraries provide an easy to use, high-level interface for working with network hardware. They have uniform interfaces, so can be used in sketches interchangeably, with minimal code changes. After the initial hump of getting a board recognized by Arduino IDE, and getting the first sketch to upload and run, the development went smoothly. To be fair, the “development” in my case was mostly copying and tweaking code samples. But it was still good!
(This was in 2021, and the maintainer fixed it the next day.)
croniter is a python library for evaluating cron expressions. Given a cron expression and a datetime, it can calculate the nearest next datetime that matches the given cron expression.
I was fuzzing the croniter library with atheris, and found an expression that caused the python process to eat CPU for about 10 seconds and then crash:
>>> it = croniter("0-1000000000 * * * *", datetime.now())
Killed
When I made the number bigger, I got a MemoryError:
>>> it = croniter("0-1000000000000 * * * *", datetime.now())
Traceback (most recent call last):
  File "<stdin>", line 1, in <module>
  File "/home/user/venvs/croniter-fuzzing/lib/python3.8/site-packages/croniter/croniter.py", line 115, in __init__
    self.expanded, self.nth_weekday_of_month = self.expand(expr_format)
  File "/home/user/venvs/croniter-fuzzing/lib/python3.8/site-packages/croniter/croniter.py", line 634, in expand
    return cls._expand(expr_format)
  File "/home/user/venvs/croniter-fuzzing/lib/python3.8/site-packages/croniter/croniter.py", line 584, in _expand
    e_list += (["{0}#{1}".format(item, nth) for item in rng]
MemoryError
And when I made it even bigger, I got an OverflowError:
>>> it = croniter("0-1000000000000000000000000 * * * *", datetime.now())
Traceback (most recent call last):
  File "<stdin>", line 1, in <module>
  File "/home/user/venvs/croniter-fuzzing/lib/python3.8/site-packages/croniter/croniter.py", line 115, in __init__
    self.expanded, self.nth_weekday_of_month = self.expand(expr_format)
  File "/home/user/venvs/croniter-fuzzing/lib/python3.8/site-packages/croniter/croniter.py", line 634, in expand
    return cls._expand(expr_format)
  File "/home/user/venvs/croniter-fuzzing/lib/python3.8/site-packages/croniter/croniter.py", line 584, in _expand
    e_list += (["{0}#{1}".format(item, nth) for item in rng]
OverflowError: Python int too large to convert to C ssize_t
Clearly, this version of croniter is missing a range check somewhere, and is attempting to do an O(n) operation with a user-supplied n. How bad is it? It depends on where and how the library is used:
If this can be triggered in a web application by a web request, an attacker can mount an easy DOS attack.
If a bad expression slips deeper in a scheduling or monitoring system, it could cause crashes or even crash loops in its internal processes.
I reported the issue privately to the maintainer, they acknowledged the issue the same day, and had a fixed version (v1.0.5) out the next day.
I upgraded Healthchecks.io to use the fixed version, and also contacted some of the larger croniter users I could find (Apache Airflow, Sentry.io, Cronitor.io) to let them know about the issue and the fix.
Since then I’ve written a separate, smaller cron expression handling library, cronsim, and switched Healthchecks.io to using it. Some of the other bugs I found by fuzzing croniter were hard to fix due to how the code has evolved. At one point I realized a clean rewrite made more sense.
PS. One extra thing before I go: crontab.guru in Chrome does not like this expression either 🙂
Let’s say you have a script that works when run in an interactive session, but does not produce expected results when run from cron. What could be the problem? Some potential culprits include:
The cron daemon does not see the new job. You added the job definition to a file that the cron daemon does not read.
The schedule is wrong. The job will run eventually, but not at your intended schedule.
cron’s PATH environment variable is different from the one in your interactive shell, so the script could not find a binary.
cron uses /bin/sh, which may be /usr/bin/dash instead of /usr/bin/bash, and your script relies on a bash-only feature.
The script uses relative filesystem paths and is intended to be run from a specific directory. When run by cron, the filesystem paths are all wrong.
Or it could be something else. How to troubleshoot this then, and where to start? Instead of trying fixes at random, I prefer to start by looking at logs:
Look at the system logs to see if cron ran the script at all.
Inspect the script’s stdout and stderr output for error messages and other clues.
System Logs
To check system logs on modern Linux systems using systemd, use the “journalctl” command:
journalctl -t CRON --since "today"
The “-t CRON” argument tells journalctl to show log entries with the “CRON” tag only. The “–since” parameter accepts timestamps and time durations in various formats. A couple of examples:
If cron did run the job, you will find log entries that look like this:
jan 25 15:27:01 foo CRON[511824]: (user) CMD (/home/user/make-backup.sh)
jan 25 15:27:01 foo CRON[511823]: (CRON) info (No MTA installed, discarding output)
The first line shows the command line cron tried to run. The second line shows that the command generated some output, and cron discarded it. If the command completes without producing any output, or if your system has an MTA such as Postfix or sSMTP installed, the second line will be absent.
Checking Script’s Output
If a cron job produces output, cron will attempt to email the command’s output to the email address specified in the MAILTO= line in crontab. For this to work, the system needs to have a configured message transfer agent (MTA). See How to Send Email From Cron Jobs for instructions on how to configure sSMTP as a MTA.
Logging to System Logs
If you want to avoid the hassle of setting up a working MTA, a simpler option is to pipe the script’s output to the system log:
The cron expression 0 4 * * * means “run this job ar 4:00 every day”.
/home/user/make-backup.sh is the script we want cron to run.
2>&1 redirects sderr to stdout.
|, the pipe character, pipes output (both stdout and stderr, thanks to the redirection) from the previous command into the following command.
logger -t backups reads data from stdin and writes it to systemd logs, tagged as “backups”.
After the cron job has run, you can inspect its output with the journalctl utility:
journalctl -t backups --since "today"
To view live logs in the follow mode:
journalctl -t backups -f
Logging to Files
An even simpler option for an ad-hoc debugging session is to write the script’s output to a file. In this example, the log file gets overwritten each time the job runs, so it will only contain the output of the most recent run:
> (right angle bracket) redirects output to a file.
2>&1 redirects sderr to stdout.
Note: bash has a shorthand for redirecting stdout and stderr to a file: &> /path/to/file. dash does not support it, so it is safer to use the longer form: > /path/to/file 2>&1.
In this example, logs from each run get appended to a single file, and each line is prefixed with a timestamp:
The combined output is piped to ts, which prefixes each line with a timestamp.
Finally, >> redirects output to a file in append mode.
Note: The “ts” utility may not be installed by default. For Debian-based systems, it is available in the “moreutils” package.
Logging to Healthchecks.io
And yet another option is to forward the logs to Healthchecks.io and view them in the web browser. With this option, you also get external monitoring and notifications when your job does not complete on schedule or exits with non-zero exit status:
The m=$(...) syntax runs the enclosed command and assigns its output to the variable $m
The semicolon separates two consecutive commands (without piping one’s output to the other)
curl’s --data-raw "$m" parameter sends the contents of $m in HTTP request body
$? is the exit status of the previous command. We tack it onto the URL so Healthchecks knows if the command finished successfully (exit status 0) or unsuccessfully (exit status > 0).
If the script produces a lot of output, you may get an error:
/usr/bin/curl: Argument list too long
In that case, one workaround is to save the output to a temporary file, then tell curl to read request body from the file:
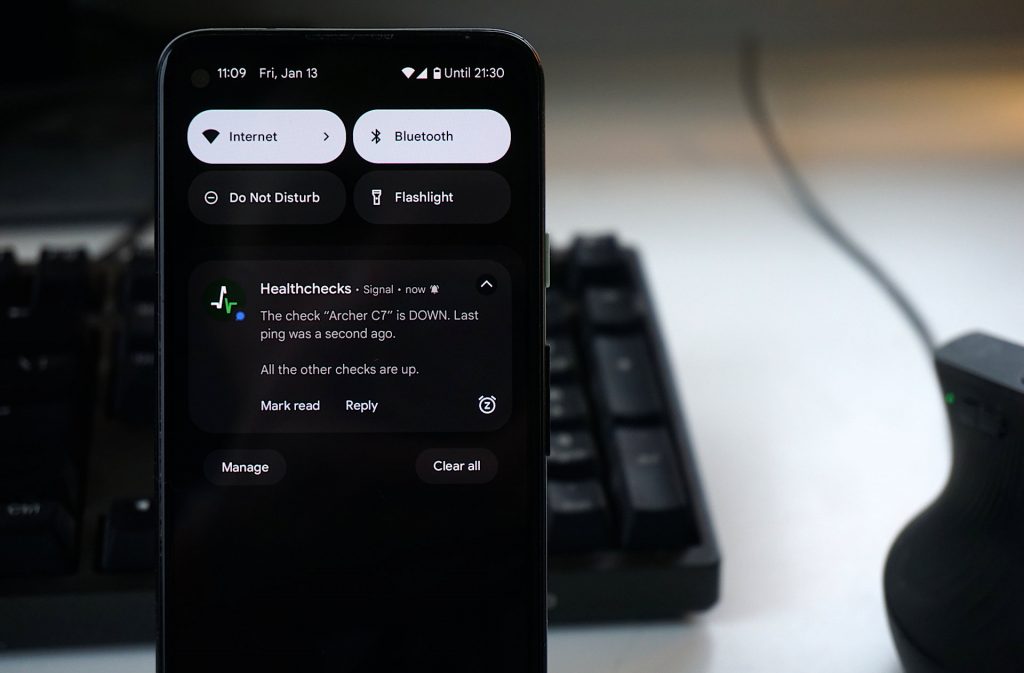
When a cron job does not run on time, Healthchecks can notify you using various methods. One of the supported methods is Signal messages. Signal is an end-to-end encrypted messenger app run by a non-profit Signal Foundation. Signal’s mobile client, desktop client, and server are free and open-source software (with some exceptions–read on!).
No Incoming Webhooks
Unlike most other instant messaging services, Signal does not provide incoming webhooks for posting messages in chats. If you want to send messages on the Signal network, you must run a full client, and follow all the same cryptographic protocols that normal end-user clients follow. This is inconvenient for the integration developer but makes sense: the main feature of Signal is strong cryptography and as little as possible sharing of information with the Signal servers. The servers pass around messages, and help with peer discovery, but (as far as I know) cannot send their own messages on the user’s behalf. Official incoming webhooks would conflict with the overall architecture of the system.
signal-cli
signal-cli is a third-party open-source Signal client. It uses the same signal client libary that the official clients use but offers a programmatic interface for sending and receiving messages. signal-cli supports command-line, DBUS, and JSON-RPC interfaces.
Signal’s official position on the signal-cli client seems to be–they do not support it, but they also have not explicitly banned it. When I asked Signal Support about their stance regarding signal-cli (and also about advice regarding rate-limit issues discussed below), I got just this short response back:
Due to our limitations as a non-profit organization, we can only provide support for the product we provide. Signal-cli is not provided or maintained by us, therefore we cannot provide any support for it.
Using signal-cli in Healthchecks
I coded the initial Signal integration in January 2021. To send messages, it was running a signal-cli send -m 'text goes here' command for every message. Each send took a minimum of one second, as every signal-cli invocation was initializing JVM, and initializing network connections, just to do one small send operation. A more efficient approach was to run signal-cli in daemon mode and talk to it via DBUS or JSON-RPC.
Also in January 2021, I upgraded the integration to talk to signal-cli over DBUS. This took some tinkering to figure out the DBUS interface configuration and to get python code to talk to it. But it worked, and message delivery was now much quicker.
In December 2021, signal-cli added the JSON-RPC interface, and I switched the Healthchecks integration to it. Again, it took a fair bit of tinkering and support from the signal-cli author until I figured out how it all hangs together, how to read and write messages over a UNIX socket, and how to interpret them. There were two important improvements over the previous DBUS code:
Simpler operations: I did not need the DBUS service with its associated configuration files anymore.
The Healthchecks project did not need the “dbus-python” dependency anymore.
Rate limiting and CAPTCHAs
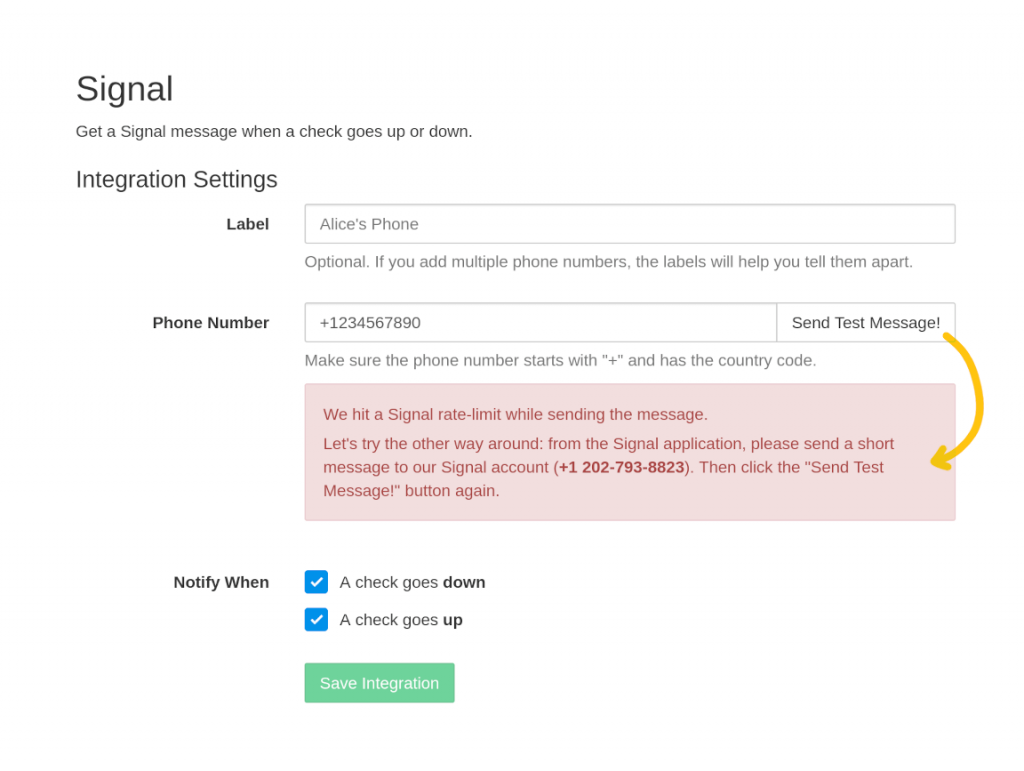
Around April 2022 I started to notice that some send operations were failing with an error message asking to solve a CAPTCHA challenge. These errors were infrequent at first and seemed to only affect the very first messages to new recipients. I added code to email me the CAPTCHA challenges, and I added a crude command-line utility to submit the CAPTCHA solutions. As the CAPTCHA challenges came in, I manually solved and submitted them. Signal was using Google reCAPTCHA, and I got plenty of opportunities to demonstrate my intelligence by expertly clicking on fire hydrants, crosswalks, and traffic lights. Sometimes at odd hours, sometimes roadside over a mobile hotspot.
As the frequency of CAPTCHAs gradually increased, I tried to make solving them less annoying:
I figured out that being logged in gmail.com helps the CAPTCHA solving a lot. Usually just a single click, no fire hydrants.
I made a web form for submitting CAPTCHA solutions. No need to fire up the terminal, just click a link in the email, and paste the solution.
Now solving a CAPTCHA challenge took just a few clicks, but the end-user experience was still not great. For some users, Signal notifications would not work until I showed up and solved yet another CAPTCHA. I did some spelunking in the signal-server code base. There is a class listing various rate-limiters and their parameters. For any rate limiter, I could trace back where and how it was used. But I still could not pinpoint the piece of code that triggers the specific rate-limit errors I was seeing. Signal-Server has an “abusive-message-filter” module, which is private code, perhaps the logic lives there.
It seemed only the initial messages to new recipients were triggering rate-limit errors. After a single message got through, the following messages would work with no issues. So my next idea was to change the Signal integration onboarding flow:
After the user has entered the phone number of the Signal recipient, ask them to send a test message
If the test message generates a rate-limit error, ask the user to initiate a conversation with us from their side, then try again:
My working theory is that users initiating the conversation with Healthchecks will look less abusive to Signal’s abusive message filter, and will help avoid hitting rate limits. But, if the theory fails and we still get rate-limit errors, at least the users will not create dysfunctional integrations (the “Save Integration” button becomes available only after successfully sending a test message).
In Summary
In summary, Healthchecks uses signal-cli to send Signal messages. It talks to signal-cli over JSON-RPC. To avoid rate limits, it asks the user to send the first message from their end. Building and maintaining the Signal integration has taken more effort than any other integration. But that is fine and, aside from the manual CAPTCHA solving, time well spent. I’m glad Healthchecks supports it, and I’m happy to see that the Signal integration is popular among Healthchecks.io users.
Starting from January 1, 2023, our ping endpoints (hc-ping.com, hchk.io) will reject requests from the Russian Federation IP addresses. The web dashboard at https://healthchecks.io will remain accessible and functional. We’ve sent email notifications to the affected user accounts.
The rejected ping requests will receive HTTP 403 responses. We will be using the GeoIP2 database to geo-locate IP addresses. To test a particular IP address, you can use the GeoIP2 demo tool. If your address gets geolocated incorrectly, please let us know.
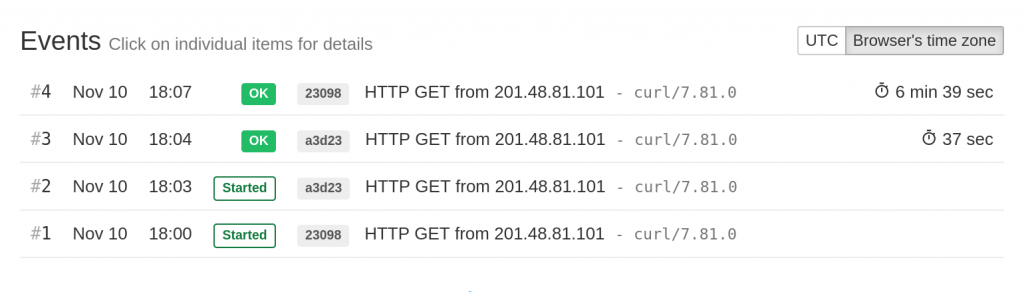
Healthchecks.io recently got a new feature: run IDs.
RID=`uuidgen`
# Send a "start" signal, specify ?rid query parameter
curl https://hc-ping.com/your-uuid-here/start?rid=$RID
# ... do some work here ...
# Send a "success" signal, specify the same ?rid value
curl https://hc-ping.com/your-uuid-here?rid=$RID
Run IDs are client-chosen UUID values that the client can optionally add as a “rid” query parameter to any ping URL (success, /start, /fail, /log, /{exitcode}).
What are run IDs useful for? Healthchecks.io uses them to group events from a single “run”, and calculate correct run durations. This is most important in cases where multiple instances of the same job can run simultaneously, and partially or fully overlap. Consider the following sequence of events:
12:00 start
12:01 start
12:05 success
12:06 success
Without run IDs, we cannot tell if the second success event corresponds to the first or the second start event. But with run IDs we can:
12:00 start, rid=05f4aa48…
12:01 start, rid=7671e111…
12:05 success, rid=05f4aa48…
12:06 success, rid=7671e111…
The usage of run IDs is completely optional. You don’t need them if your jobs always run sequentially. If you do use run IDs, make sure that:
the rid values are valid UUIDs in the canonical text form (with no curly braces, with no uppercase letters)
you use the same rid value for matching start and success/fail events
Healthchecks.io will show the run IDs in a shortened form in the “Events” section:
In the above image, note how the execution times are available for both “success” events. If the run IDs were not used, event #4 would not show an execution time since it is not directly preceded by a “start” event.
Alerting Logic When Using Run IDs
Healthchecks.io monitors the time gaps between “start” and “success” signals: if a job sends a “start” signal, but then does not send a “success” signal within its configured grace time, Healthchecks.io will assume the job has failed and notify you. However, if multiple instances of the same job run concurrently, Healthchecks.io will only monitor the run time of the most recently started run and alert you when it exceeds the grace time. Under the hood, each check tracks a single “last started” value, which gets overwritten with every received “start” event.
To illustrate, let’s assume the grace time of 1 minute, and look at the above screenshot again. Event #4 ran for 6 minutes 39 seconds and so overshot the time budget of 1 minute. But Healthchecks.io generated no alerts because the most recently started run finished within the time limit (it took 37 seconds, which is less than 1 minute).
The crontab man page (“man 5 crontab” or read online) contains this bit:
Note: The day of a command’s execution can be specified by two fields — day of month, and day of week. If both fields are restricted (i.e., don’t start with *), the command will be run when either field matches the current time. For example, 30 4 1,15 * 5 would cause a command to be run at 4:30 am on the 1st and 15th of each month, plus every Friday.
What does it mean precisely? If you specify both the day of month and the day of week field, then cron will run the command when either of the fields match. In other words, there’s a logical OR relationship between the two fields. Let’s look at an example:
0 0 1 * MON
This expression translates to “Run at the midnight if it’s the first day of the month OR Monday”. An expression like this could be handy for a job that sends weekly and monthly reports as it probably needs to run at the start of every week, and the start of every month. However, if either field is unrestricted, the logical relationship between the fields changes to “AND”. For example:
0 0 * * MON
Here, the day of month field is unrestricted. Cron will run this command when both the day of month field AND the day of week fields match. Since * matches any day of month, this expression effectively translates to “Run at midnight every Monday”.
So far so good! The sometimes-OR relationship between the two fields is a relatively well-known cron gotcha. But let’s look closer at what values cron considers “unrestricted”. Star (*) is of course unrestricted, but, according to the man page, any value that starts with the star character is also unrestricted. For example, */2 is unrestricted too. Can we think of any useful schedules that exploit this fact? Yes, we can:
0 0 1-7 * */7
Here, the day of month is restricted to dates 1 to 7. Cron will interpret */7 in the day of week field as “every 7 days starting from 0 (Sunday)”, so, effectively, “Every Sunday”. Since the day of week field starts with *, cron will run the command on dates 1 to 7 which are also Sunday. In other words, this will match midnight of the first Sunday of every month.
In the above example, */7 is a trick to say “every Sunday” in a way that starts with the star. Unfortunately, this trick only works for Sunday. Can we make an expression that runs on, say, the first Monday of every month? Yes, we can!
0 0 */100,1-7 * MON
The day of month field here is */100,1-7, meaning “every 100 days starting from date 1, and also on dates 1-7”. Since there are no months with 100+ days, this again is a trick to say “on dates 1 to 7” but with a leading star. Because of the star, cron will run the command on dates 1 to 7 that are also Monday.
OK, but does any of this work? Is the man page accurate? Yes: you can check the cron source here and see how it initializes the DOW_STAR and DOM_STAR flags by testing just the first character of the fields. I’ve also tested both expressions empirically by setting up dummy cron jobs and monitoring when they run. I ran them in a VM with an accelerated clock, which I’ve used for experiments before.
An important caveat before you use these tricks for scheduling your tasks: there are many systems that support cron-like syntax for scheduling tasks. It’s a safe bet not all of them implement all the quirks of the classic cron. Always check if your scheduler supports the syntax and logic you are planning to use. And always monitor if your scheduled tasks do run at the expected times (wink wink)!
Q: Can you share more details about what the 4 HAProxy servers are doing?
The traffic from the monitored systems comes with spikes. Looking at netdata graphs, currently the baseline is 600 requests/s, but there is a 2000 requests/s spike every minute, and 4000 requests/s spike every 10 minutes.
Want to maintain redundancy and capacity even when a load balancer is removed from DNS rotation (due to network problems, or for upgrade).
There are spare resources on the servers, especially RAM, and I could pack more things on fewer hosts. But, with Hetzner prices, why bother? 🙂
Q: Why Braintree, not Stripe?
When I started, Stripe was not yet available in my country, Latvia (it now is).
Personally I’ve had good experience with Braintree. Particularly their support has been impressively good – they take time to respond, but you can tell the support agents have deep knowledge of their system, they have access to tools to troubleshoot problems, and they don’t hesitate to escalate to engineering.
Q: I’d like to hear more on your usage of SSLMate and SOPs.
SSLMate it is a certificate reseller with a convenient (for me) interface – a CLI program. It’s no fun copy-pasting certificates from email attachments.
I’m using both RSA and ECDSA certificates (RSA for compatibility with old clients, ECDSA for efficiency). I’m not sure but looks like ECDSA is not yet generally available from Let’s Encrypt.
On sops: the secrets (passwords, API keys, access tokens) are sitting in an encrypted file (“vault”). When a Fabric task needs secrets to fill in a configuration file template, it calls sops to decrypt the vault. My Yubikey starts flashing, I tap the key, the Fabric task receives the secrets and can continue.
Q: I would love to hear more detail how WireGuard is set up.
I use vanilla Wireguard (the wg command and the wg-quick service). I set up new hosts and update peer configuration using Fabric tasks. It may sound messy, but works fine in practice. For example, to set up Wireguard on a new host:
On the new host, I run a Fabric task which generates a key pair and spits out the public key. The private key never leaves the server.
I paste the public key in a peer configuration template.
On every host that must be able to contact the new host, I run another Fabric task which updates the peer configuration from the template (wg syncconf).
One thing to watch out is any services that bind to the Wireguard network interface. I had to make sure on reboot they start after wg-quick.
Q: I am curious how sites like this handle scheduled tasks that have to run at high frequencies? Cron on one machine? Celery beat?
Healthchecks runs a loop of
10 send any due notifications
20 SLEEP 2
30 GOTO 10
The actual loop is of course a little more complicated, and is being run concurrently on several machines.
Q: How did you go about implementing the integrations (email, Signal, Discord….)?
Started with just the email integration, and added other integration types over time, one by one. A few were contributed as GitHub PRs.
The Signal one took by far the most effort to get going. But, for ideological reasons, I really wanted to have it 🙂 Unlike most other services, Signal doesn’t have public HTTP API for sending messages. Instead you have to run your own local Signal client and send messages through it. Healthchecks is using signal-cli.
Q: What volume of data are you storing in PostgreSQL? Any reason not to use a hosted PostgreSQL provider?
Around 200 write tx/s as a baseline. Spikes to 2000 write tx/s at the start of every minute, and 4000 write tx/s every 10 minutes.
Not using a hosted PostgreSQL provider for several reasons:
Cost
Schrems II
From what I remember, both Google Cloud SQL and AWS RDS used to have mandatory maintenance windows. The fail-over was not instant, so there was some unavoidable downtime every month. This was a while ago – maybe it is different now.
Q: Is the decision not to use Patroni for HA PostgreSQL in this case, so that you don’t add more complexity?
Yes. Plus, from reading database outage postmortems, I was not comfortable making the “do we fail-over now?” decision automatic. Think about the brownouts, where the primary is still up, but slow. Or it experiences intermittent packet loss.
I’ve automated the mechanics of the fail-over, but it still must be initiated manually.
Q: I’m getting the impression, the bus factor at Healthchecks.io seems to be 1. If I’d run a one man show type of business, I’d love to have some kind of plan B in case I’d be incapacitated for more than half a day.
Yes, the bus factor is 1, and it’s bugging me too. I think any realistic plan B involves expanding the team.
Q: How much does it all cost?
I don’t have a precise number, but somewhere in the €800/mo region.
Q: How do you think open-sourcing the self-hosted version of your product impacted your sales? Positively, negatively?
I can’t say definitely, but my gut feeling is positively.
What if another operator takes the source code, and starts a competing commercial service? I’ve seen very few (I think 1 or 2) instances of somebody attempting a commercial product based on Healthchecks open-source code. I think that’s because it’s just a lot of work to run the service professionally, and then even more work to find users and get people to pay for it.
What if a potential customer decides to self-host instead? I do see a good amount of enthusiasts and companies self-hosting their private Healthchecks instance. I’m fine with that. For one thing, the self-hosting users are all potential future clients of the hosted service. They are already familiar and happy with the product, I just need to sell the “as a service” part.
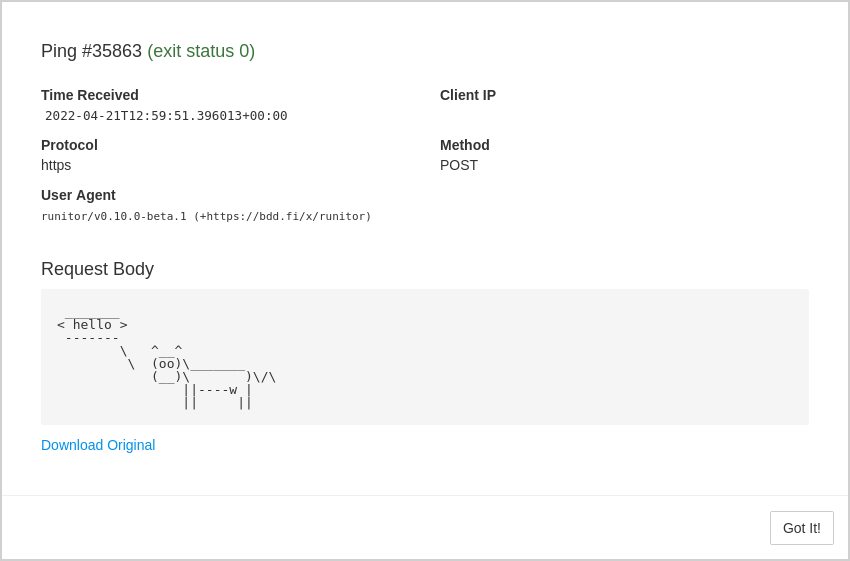
When clients make HTTP POST requests to ping URLs, Healthchecks captures and stores request body data. You can use this feature to log a command’s output and have it available for inspection later:
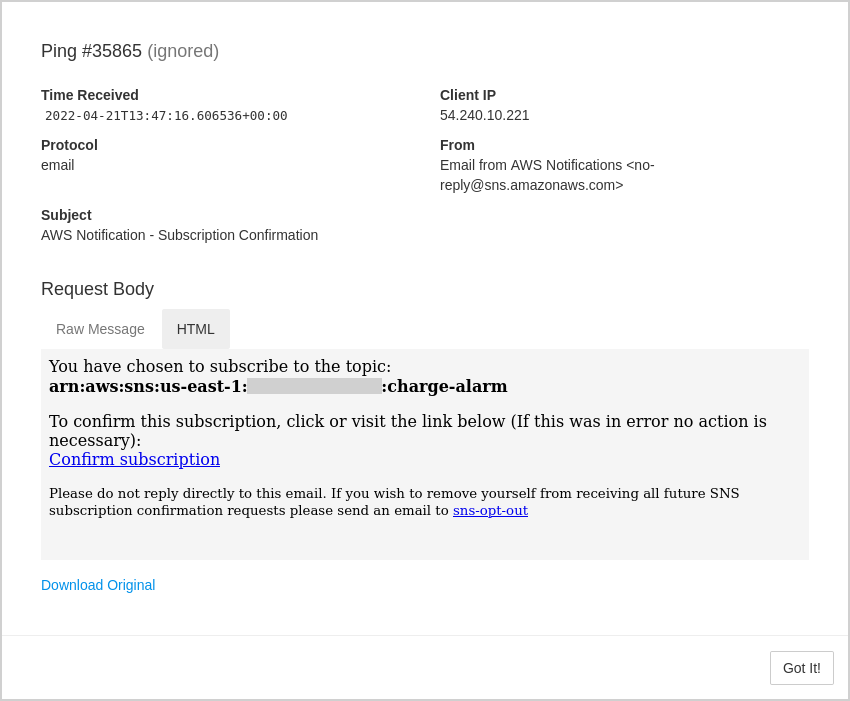
Healthchecks also captures and stores email messages, when pinging by email:
There is a limit to how much data gets stored. The limit used to be 10KB. For example, if a client sends 50KB in an HTTP POST request body, Healthchecks would store the first 10KB, and ignore the remaining 40KB. I recently bumped up the size limit to 100KB. Users can now attach 10x more log information to every HTTP POST request, and HTML-heavy email messages are now less likely to get chopped off in the middle.
In theory, the limit change could have been as simple as adding one zero to a configuration parameter, but in practice, there was a little bit more to it!
Database vs S3
Healthchecks used to store request body data in its primary and only data store, a PostgreSQL database. Bumping up the limit and throwing more data in the database would work in the short term, but would create problems in the long run. Backup sizes and processing times would grow at a quicker rate. Network I/O to the database server would also increase, and sooner become a bottleneck.
Now, how about outsourcing ping body storage to AWS S3? This would allow bumping up the size limit without ballooning the database size (yay!). On the other hand, this would add a new moving part to the system, and increase code and operational complexity (oh no!). But perhaps still worth it?
Healthchecks would be doing lots of small S3 PUT requests, and AWS S3 has per-request fees. Quick napkin math: AWS charges $0.005 per 1000 PUT requests. Let’s say we’re uploading 20 objects to S3 per second. That’s 20 * 60 * 60 * 24 * 30 = 52M PUT requests per month, or $260 added to the AWS bill. AWS also charges for bandwidth and storage. And what about Schrems II? There could be personal data in ping bodies, so we would need to encrypt them before handing them off to AWS.
Luckily there are alternate, S3-compatible object storage providers, some of them based in the EU, and some of them charge no per-request fees! Scaleway and OVH looked like two promising candidates.
Sync vs Async Uploads
OK, let’s dive into implementation decisions. When Healthchecks receives a ping, should it upload request body data to S3 right away, in the HTTP request-response cycle? Or should it stash the request body data somewhere and have a background process deal with the uploads?
The synchronous approach is simple operationally (no background processing to worry about), but the S3 upload operations can slow down the request-response cycle.
The async approach is more fiddly to set up. The background worker process can throw an exception or grow a backlog of jobs, it needs to be monitored. On the upside, any S3 API hiccups or slowdowns would not affect the ping handler’s throughput.
Easy solution–I implemented both methods! The open-source Healthchecks project uploads ping bodies synchronously. But on the hosted service (healthchecks.io), the ping handler stores received pings on the filesystem, and a separate worker process picks them up and uploads them to S3.
Homegrown API requests vs S3 Client Library
Moving forward, how does one upload an object to an S3 bucket? I’ve used boto3 in the past, but how hard could it possibly be to send the right payload to the right API endpoint?
If the ping body is just a few bytes in size, does it still make sense to offload its storage to S3? Probably not. There should be some threshold value (say, 100 bytes), below which ping bodies still get stored in the database.
Any data that we put or retrieve from object storage we will treat as binary. But the “body” field in the Healthchecks database has historically been a text field, only appropriate for storing Unicode strings.
To avoid the inconsistency of storing short ping bodies as Unicode strings, and longer ping bodies as binary data, I added a new “body_raw” binary field in the database and updated the application code to use it by default.
Object Key Naming Scheme
What naming scheme to use for keys in the S3 bucket? The most straightforward naming scheme would be /<uuid>/<n>:
/504eb741-1966-49fe-a6e7-4d3133d2b2bd/1
/504eb741-1966-49fe-a6e7-4d3133d2b2bd/2
/504eb741-1966-49fe-a6e7-4d3133d2b2bd/3
…
/504eb741-1966-49fe-a6e7-4d3133d2b2bd/100
/504eb741-1966-49fe-a6e7-4d3133d2b2bd/101
…
Here “uuid” would be the unique UUID of a check, and “n” is the serial number of the received ping: “1” for the first received ping, “2” for the second received ping, and so on.
Now, let’s say we are cleaning up old objects and want to delete all objects with uuid=504eb741-1966-49fe-a6e7-4d3133d2b2bd and n<50. How to do that? With the above naming scheme, we could:
Retrieve a list of all objects with the prefix /504eb741-1966-49fe-a6e7-4d3133d2b2bd/.
Filter the list, keeping only the entries with n<50
Then run the DeleteObjects API call and pass the filtered list to it.
I noticed the list_objects call has an optional start_after argument, perhaps it can be used to avoid the client-side filtering (step 2)?
Yes, it can – if we add specially crafted sorting prefixes to the object keys:
I ran into an issue when using the minio-py’s remove_objects call: when generating a request XML, it was serializing boolean values as True and False, instead of true and false. When testing, this was accepted by AWS S3 API, but both Scaleway and OVH were rejecting these requests as invalid.
I filed an issue with minio-py, and they fixed the code to serialize boolean values to lowercase strings.
I reported the issue to Scaleway and OVH, both fixed their S3 implementation to accept capitalized boolean values.
Object Storage Cleanup
Let’s say a user is closing their Healthchecks account, and we want to delete their data. With Django and relational databases, it is remarkably easy to do:
user.delete() # that's it
Django will delete the user record from the auth_user table, and will also take care of deleting all dependent objects: projects, checks, channels, pings, notifications, etc. All of that, with one line of code!
For the S3 object storage though we will need to take care of data cleanup ourselves. I wrote a pruneobjects management command which iterates through the S3 bucket and removes all objects referencing checks that do not exist in the database anymore.
Testing Object Storage Providers
I initially planned to use Scaleway Object Storage. I contacted their support and got a confirmation that my planned use case is reasonable. As I was using Scaleway to test my work-in-progress code, I saw their DeleteObjects API calls were rather slow. They would often take seconds, and sometimes tens of seconds to complete. Around that time Scaleway object storage also happened to have a multi-hour outage. API calls were returning “InternalError” responses, the dashboard was not working.
I switched my focus to OVH. Same as with Scaleway, I contacted OVH support and described my use case and planned usage patterns. I explicitly asked about API request rates, they said–no limits. I set up the account and got busy testing. The API operations seemed significantly quicker. DeleteObjects would typically complete in a sub-second.
I did run into several hopefully teething troubles with OVH too. API would sometimes return “ServiceUnavailable, Please reduce your request rate.” OVH would acknowledge the issue with this masterpiece of an explanation:
The problem you have encountered is due to occasional operations that have taken place on the platform.
When the number of objects in the bucket went above 500’000, OVH dashboard couldn’t display the bucket’s contents anymore. The page would take a long time to load and eventually display “Internal server error”. This issue has not been resolved yet. But the API works.
“Ping Body Not Yet Available” Special Case
If ping bodies are being uploaded asynchronously, we can run into a situation where we want to show the ping body to the user, but it is still sitting in a queue, waiting to be uploaded to S3. Here’s an example scenario:
Client sends a “fail” event with data in the request body.
Ping handler registers the ping and adds the body data to the upload queue.
Milliseconds later, the “sendalerts” process sees the failure and prepares an email notification. It needs the ping body, which is not present in the S3 bucket yet.
Note that the ping handler and sendalerts may be running on different machines, so sendalerts cannot peek in the upload queue either.
My “good enough” solution for this was to add a conditional delay to the email sending logic:
Fetch the request body from S3.
If not found, wait 5 seconds, then fetch it again.
If still nothing, use a “The request body data is being processed” fallback message in the email.
The idea here is that request bodies usually upload quickly. Assuming normal operation and no significant backlog, 5 seconds should be plenty. But if the request body is still not available after the 5 seconds, we don’t want to delay the email notification too much, and use the fallback message.
S3 Backup
In theory, OVH claims a 100% resilience rate for their object storage service. But we know entire data centers can and sometimes do burn down, and ultimately it is our responsibility to be able to recover the data. My S3 backup solution is a cron job on a dedicated VPS, doing the following:
Download entire contents of the bucket using “aws s3 sync”.
Pack the files together using tar, encrypt them with gpg, and upload the resulting file to a different bucket at a different provider.
The “aws” command is provided by the awscli tool. s3cmd also has a “sync” command, but in my testing, it could not handle a bucket with hundreds of thousands of objects.
The “n % 50 == 0” Bug
As I was working on implementing S3 backup, I noticed that the bucket contains more data than I was expecting. Some checks had 8000 and more ping bodies stored. How?
The cleanup logic for asynchronous uploads is:
Pick a ping body from the queue, upload it to S3.
If the ping’s serial number is divisible by 50, run a cleanup routine.
The idea is to run the cleanup routine every 50 pings. Now, what happens if the client sends alternating “start” events as HTTP GET requests, and “success” events as HTTP POST with a request body? We can have a situation where every POST has an odd serial number, and so our cleanup routine never runs! My “good enough” fix here was to change the constant “50” to a non-even number.
The 10KB to 100KB Limit Increase
With the above in place, I added OVH to the list of sub-processors in the Privacy Policy, increased the ping body limit to 100KB and gradually rolled out the changes to production servers. After several days of testing to see if everything is coping well, I announced the limit increase on Twitter.
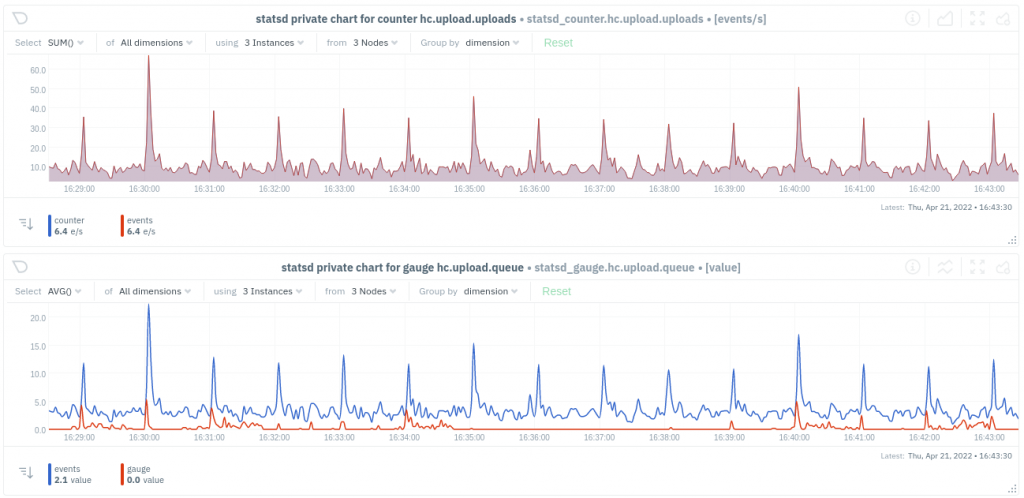
Here are graphs from Netdata showing the object uploads per second, and the backlog size, aggregated across all web servers:
And that’s how “we” moved some data to S3. Thanks for reading! –Pēteris.