On May 27, I woke up to an email that said “Your Twilio account is suspended and will continue to be charged”. Top of the morning!
I then found out that for the past ~12 hours, somebody had been mass-creating accounts on Healthchecks.io and sending 5 SMS messages (the allowed limit for free accounts) from each. By the time I found out, they had sent ~8000 messages to random Moroccan phone numbers and added ~$1800 to our Twilio bill. The Twilio account is configured to automatically add funds from our payment card in $250 increments when funds run low. This had been going on for a while until the card’s daily spending limit was reached and an auto-recharge failed. The funds then ran out completely, and the Twilio account got suspended.
First things first:
I changed the SMS limit for future free accounts from 5 to 0;
I deleted the mass-created accounts;
I added funds to the Twilio account to get SMS, WhatsApp, and phone call notifications working again.
Then I went through the logs to better understand what had happened.
The attacker was running an automated process which registers an account, creates a SMS integration, then sends 5 test notifications. Rinse and repeat.
The accounts were registered to @wshu.net email addresses (wshu.net seems to be a disposable email service).
Healthchecks.io rate-limits account sign-ups by IP address. The attacker was cycling through VPN IP addresses to avoid the rate limit.
Healthchecks.io rate-limits SMS notifications by phone number. The attacker was using a different Moroccan (+212) phone number for each account. It is possible Morocco does not have any special meaning here, except that SMS fees for Morocco are higher than average ($0.22/SMS).
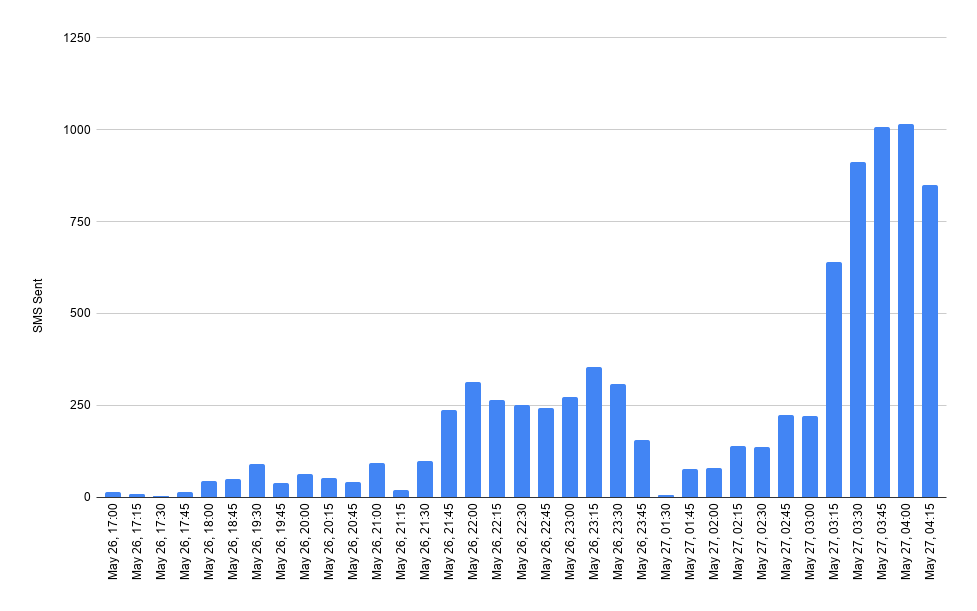
They started slow but later ramped up account creation and SMS sending:
Attacker’s HTTP requests used a standard Chrome user agent string.
Interestingly, there was at least one @wshu.net account that fits the overall pattern but has a non-Moroccan phone number. Perhaps this is a real phone number, and the attacker used it to check if SMS messages really arrive.
I submitted a request to Twilio to refund the fraudulent charges. After confirming I had fixed the attack vector (free users cannot send any SMS any more), tightened geo permissions, and enabled SMS pumping protection, Twilio graciously agreed to issue refund credit for the full amount. Thanks, Twilio!
This is the first time that someone has performed an attack specifically designed for Healthchecks.io. I do not know what their motivation was. Maybe they were trying to teach me a lesson that it is cheaper to have a bug bounty program. Anyway. All is well that ends well 🙂
Healthchecks.io ping endpoints accept HTTP HEAD, GET, and POST request methods. When using HTTP POST, clients can include an arbitrary payload in the request body. Healthchecks.io stores the first 100kB of the request body. If the request body is tiny, Healthchecks.io stores it in the PostgreSQL database. Otherwise, it stores it in S3-compatible object storage. We recently migrated from a managed to a self-hosted object storage. Our S3 API is now served by Versity S3 Gateway and backed by a plain simple Btrfs filesystem.
AWS S3 has per-request pricing, which would make it expensive-ish for Healthchecks.io usage patterns (frequent PutObject S3 operations, one operation per every large-enough ping request). Also, AWS being subject to the CLOUD Act, Healthchecks.io would need to encrypt data before handing it off to AWS, which would add complexity.
OVHcloud is what I picked initially. There are no per-request fees, OVHcloud is an EU company, and the performance seemed good. Unfortunately, over time, I saw an increasing amount of performance and reliability issues. As my experience got worse and worse, I looked for alternatives.
In 2024, I migrated to UpCloud. Same as OVHcloud, it has no per-request fees and is an EU company. There was a clear improvement in the quality of service: the S3 operations were quicker, and there were fewer server errors or timeouts. Unfortunately, over time, the performance of UpCloud object storage deteriorated as well. There were periods where all operations would become slow and hit our timeout limits. The S3 DeleteObjects operations in particular were getting slower and slower over time. So I looked for alternatives again, including self-hosted.
Requirements
Our current (April 2026) object usage is:
14 million objects, 119GB
Object sizes range from 100 bytes to 100’000 bytes. The average object size is 8KB.
30 upload operations per second on average, with regular spikes to 150 uploads/second.
Constant churn of uploaded/deleted objects.
Our candidate object storage system would need to be able to support this usage and have room to grow. Luckily, we are still at the scale where everything can easily fit on a single system, and operations like taking a full backup can be reasonably quick. Everything would be more complicated if we had many-terabyte requirements.
Availability and durability: for the Healthchecks.io use cases, the object storage is not as mission-critical as our primary data store, the PostgreSQL database. If the database goes down, the service is completely broken, and monitoring alerts stop going out. If the object storage goes down, then users cannot inspect ping bodies through the web interface or through the API, but the system otherwise still functions. If some ping bodies get permanently lost, that is bad, but not as bad as losing any data going into the PostgreSQL database.
Latency: the quicker, the better. There are places in code where Healthchecks.io does S3 operations during the HTTP request/response cycle. Individual S3 operations taking multiple seconds could choke the web server processes. While using UpCloud, I had to add some load-shedding logic to prevent slow S3 operations from escalating into bigger issues.
The Self-Hosted Options
I ran local experiments with Minio, SeaweedFS, and Garage. My primary objection to all of them was the operational complexity. It is not too hard to follow the “get started” instructions and get a basic cluster up and running. But, for a production-ready setup, I would need, as a minimum:
automate the setup of the cluster nodes,
learn and test the update procedure,
learn and test the procedure of replacing a failed cluster node,
set up monitoring and alerting for cluster-specific health issues.
Since I’m a one-person team, and I already run self-hosted Postgres, self-hosted HAProxy load balancers, and self-hosted email, I would really like to avoid taking up the responsibility of running another non-trivial system. Something simple would be much preferred.
Versity S3 Gateway
Versity S3 Gateway turns your local filesystem into an S3 server. An S3 PutObject operation creates a regular file on the filesystem, an S3 GetObject operation reads a regular file from the filesystem, and an S3 DeleteObject operation deletes a file from the filesystem. It does not need a separate database for metadata storage. You can use any backup tool to take backups. The upgrade procedure is: replace a single binary and restart a systemd service. It is written in Go, and is being actively developed. The one bug I found and reported was fixed in just a few days.
The big obvious caveat with Versity S3 Gateway and the filesystem as the backing store is, of course, availability and durability. The objects live on a single system, which can fail at any point of time without any prior warning. I need to be ready for this scenario.
The Setup
In March 2026, I migrated to self-hosted object storage powered by Versity S3 Gateway.
S3 API runs on a dedicated server. It listens on a private IP address. Application servers talk to it over Wireguard tunnels.
Objects are stored on the server’s local drives (two NVMe drives in RAID 1 configuration).
Objects are stored on a Btrfs filesystem. With Btrfs, unlike ext4, there is no risk of running out of inodes when storing lots of tiny files.
Every two hours, a rsync process synchronizes the added and deleted files to a backup server.
Every day, the backup server takes a full backup, encrypts it, and stores it off-site. We keep full daily backups for the last 30 days.
With this setup, if both drives on the object storage server fail at the same time, the system could lose up to 2 hours of not yet backed-up ping request bodies. This can be improved, as usual, with the cost of extra complexity.
The Results
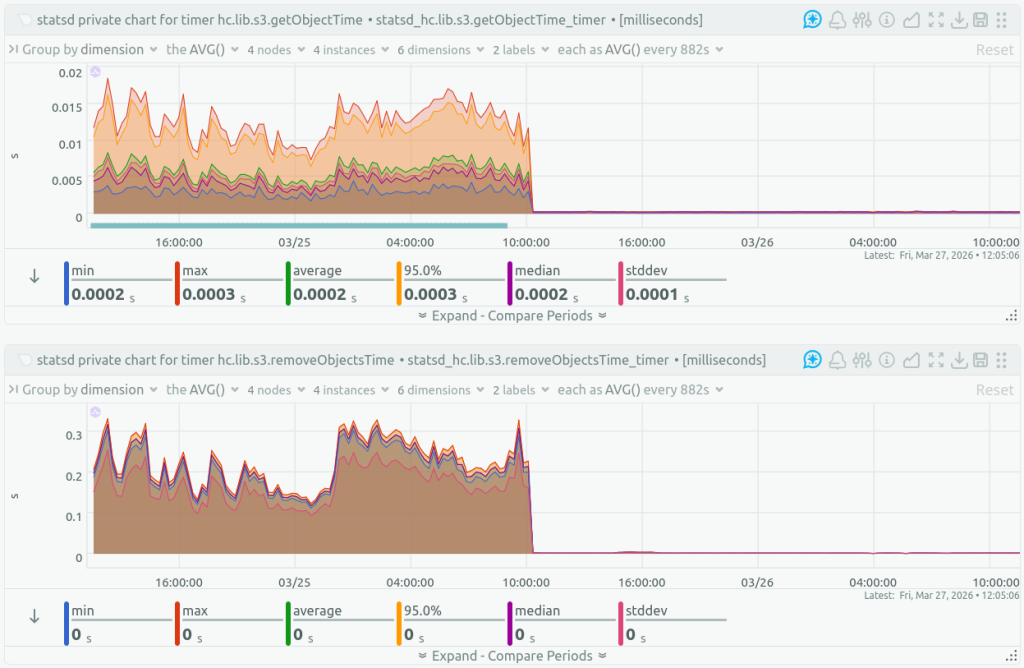
After switching to self-hosted object storage, the S3 operation latencies dropped:
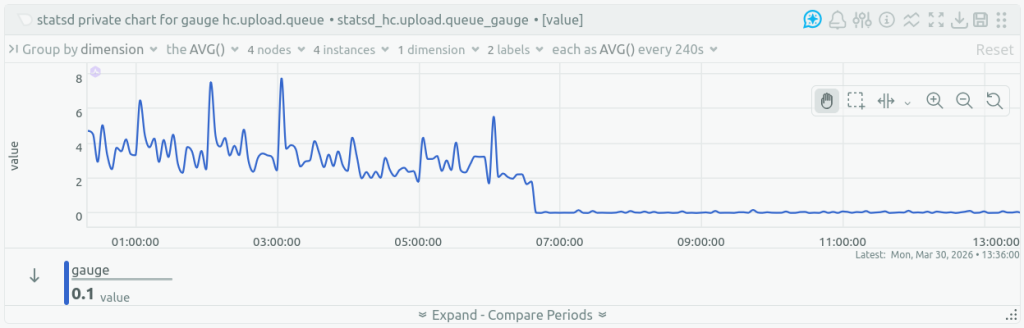
The queue of ping bodies waiting to be uploaded to object storage shrank:
There have been no availability issues yet, but the new system has been live for only a couple of weeks.
The list of our data sub-processors now has one less entry.
The costs have increased: renting an additional dedicated server costs more than storing ~100GB at a managed object storage service. But the improved performance and reliability are worth it.
I am cautiously optimistic about the new system, and I think it is an improvement over the old one. But I am also open to migrating again if I find a system with better tradeoffs.
Thanks for reading, and happy monitoring, –Pēteris
I semi-recently bought a used Roborock S5 Max robot vacuum, and installed Valetudo on it. The installation process involves rooting the robot, and gaining SSH access to it. Which got me thinking, could I get the robot to ping Healthchecks.io at regular intervals? When the robot runs into a problem (closes a door after itself, gets stuck, chokes on a loose wire) and cannot return to the base, it eventually shuts down. It would be nice to find out about that via a notification, not by eventually noticing the floors are extra dirty.
The rooted S5 Max runs a stripped down Linux system. It has curl installed. It does not appear to be running cron. The kernel uses armv7l architecture.
Thinking about my options, I remembered about runitor and its “-every ” flag. Normally, runitor sends a “start” signal to Healthchecks, runs the supplied command, then sends a “success” or “fail” signal to Healthchecks and terminates. With the “-every” flag, it stays running indefinitely and runs the same command at the specified interval. It can be used as a simple periodic task runner.
I copied the arm build of runitor to the robot vacuum’s /mnt/data/ directory and tested if it works:
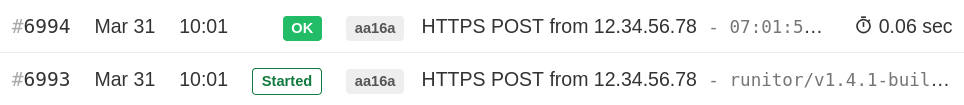
And, sure enough, the “start” and “success” signals popped up on Healthchecks:
Now the only thing left to figure out was: how to start runitor automatically when the robot vacuum boots up? Previously, I had played around with roborock-oucher – a program that makes the robot vacuum play a custom sound every time it bumps into an obstacle. oucher’s README lists several ways to run a program on startup. I found that for my specific robot model, the solution number 3 works. I created a script /mnt/data/run-runitor.sh with the following contents:
if [[ -f /mnt/data/run-runitor.sh ]]; then /mnt/data/run-runitor.sh; fi
Note: if you do something similar, double- and triple-check everything when making changes to /mnt/reserve/_root.sh. A bad edit could brick your robot.
And that was that! The robot now checks in every 5 minutes. The one extra process running on it does not seem to affect its normal operation. This was a fun little thing to set up. For other unconventional uses of Healthchecks.io, I have previously written about:
Starting from today, Healthchecks.io users on all plans (Hobbyist, Supporter, Business, Business Plus) can invite an unlimited number of users into their projects. Previously, the limits were: 3 team members for Hobbyist and Supporter, 10 team members for Business, and unlimited team members for Business Plus. From now on, it is unlimited for all.
Why did the Team Size Limit Exist?
I originally implemented the team size limits as an incentive for business users to upgrade. My thinking was: hobbyist users would be fine with a small team limit, business users with larger teams would need to upgrade. Now, with many years of data available, I consistently see the single primary reason why users upgrade is running into their account’s check limit. Situations where a customer upgrades due to hitting the team size, not the check limit, are very rare.
Why Remove it Now?
The primary reason: with the team size limit removed, account owners will generally invite more colleagues into their projects. I am betting that, in the long term, the benefit of increased word-of-mouth marketing is worth more than the profit from the few users who upgrade due to hitting the team size limit.
The secondary reason: less complexity! There’s less code to track and enforce team size limits, the pricing table is more compact, and the team size limits do not need to be explained in the documentation.
And so, the team size limit is no more. Happy monitoring, –Pēteris
The “My Checks” page on Healthchecks shows integration icons next to each check. Users can click the integrations to toggle them on and off:
I added this feature in June 2018. Before then, the Integrations column was simply absent. My initial implementation used PNG images to display the integration icons, each icon being a separate <img> element in HTML. This was a nice usability improvement, but created a performance problem: the browser stuggled to display and repaint the “My Checks” page for accounts with many checks.
I solved the performance problem by putting the integration icons in an icon font and using it instead of many small PNG images. This worked wonderfully–there was no more stutter, even when listing hundreds of checks. Browsers are really efficient at displaying text, who knew!
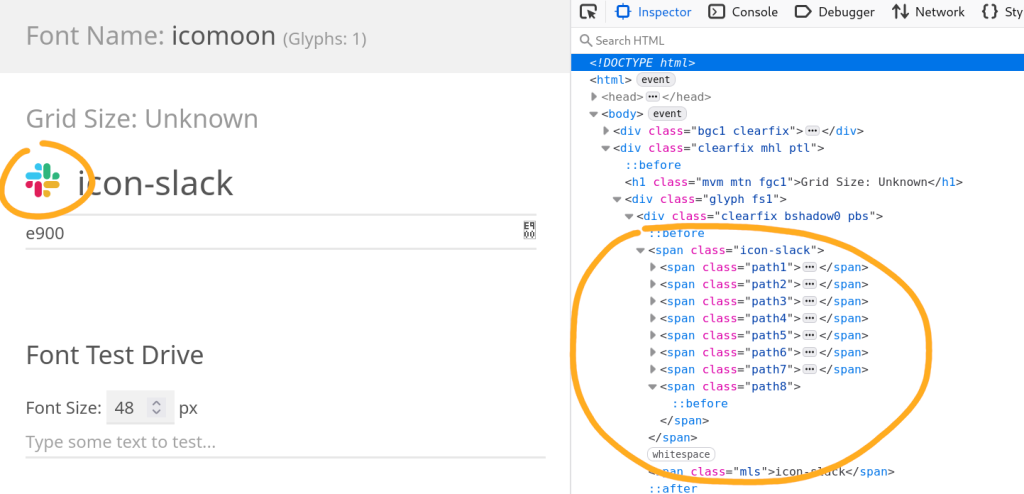
I was using icomoon.io for manipulating the icon font. It lets you assemble a set of icons, either by selecting from icon libraries or by uploading your own SVGs. You can manipulate each glyph, and you can export the font as .ttf, .woff, etc. files. IcoMoon’s UI is quirky, but the end results are good.
Icon fonts created with IcoMoon can handle icons with multiple colors, but they work best with monochrome icons. The more colors an icon uses, the more HTML elements you have to use to display it:
Moreover, the new version supports ligatures. Ligatures are conventionally used for joining multiple characters in one shape. For example, for displaying “oe” as “œ” or, in programming fonts, displaying “!=” as “≠”. In icon fonts, ligatures can be used to display a string of characters as a specific icon. This allows for even neater HTML markup:
<span class="ic">slack</span>
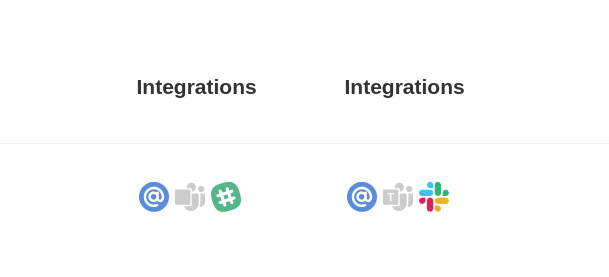
I have now updated Healthchecks to use multicolor icon fonts produced by IcoMoon’s new app, and I updated the Slack integration icon to take advantage of it (before on the left, after on the right):
Over the last few weeks, I indulged myself in doing a few “nice to have” website optimizations. They were:
Upgrade to HAProxy 3.2 and Enable HTTP/3
I recently learned that HAProxy now provides first-party Debian and Ubuntu packages. Notably, these packages are not built with the OpenSSL library, but with the faster AWS-LC. And they support HTTP/3 out of the box. Up until now, I was using HAProxy packages from the vbernat PPA, which has only limited HTTP/3 support.
Over the holiday season, I tested the AWS-LC packages with our specific HAProxy configuration (testssl.ssh was super handy here), and this week I deployed the changes to Healthchecks.io’s production load balancers and enabled HTTP/3.
The WordPress theme I had originally picked for the site was Astra. It is a relatively lightweight theme, but still has some superfluous HTML, JS, and CSS, which was bugging me to no end. During the holidays, I bit the bullet and put together a custom theme. I used the BlankSlate theme and the mvp.css stylesheet as the starting point, deleted large parts from both, and then edited the HTML markup and CSS to get the look right. Now the site looks better than before, has cleaner markup, a single CSS include, and no JS includes. Phew!
WebP for the Landing Page Graphics
I wanted to submit Healthchecks.io to 512kb.club, but the uncompressed size of the landing page was a little over the required 512kB size limit. It was only a few kilobytes over, but the low-hanging fruit optimizations were already done (or so I thought). However, I did find one unoptimized PNG image, optimized it with oxipng, and got the page just below the limit.
It later occurred to me that the size of the product illustrations (each a 30kB to 50kB PNG) could perhaps be reduced by converting to lossless WebP. Indeed, there was 30% – 50% space saving for each illustration, and the page now sits at 441kB uncompressed. And it looks the same in browsers, tested in Firefox, Chrome, andLadybird.
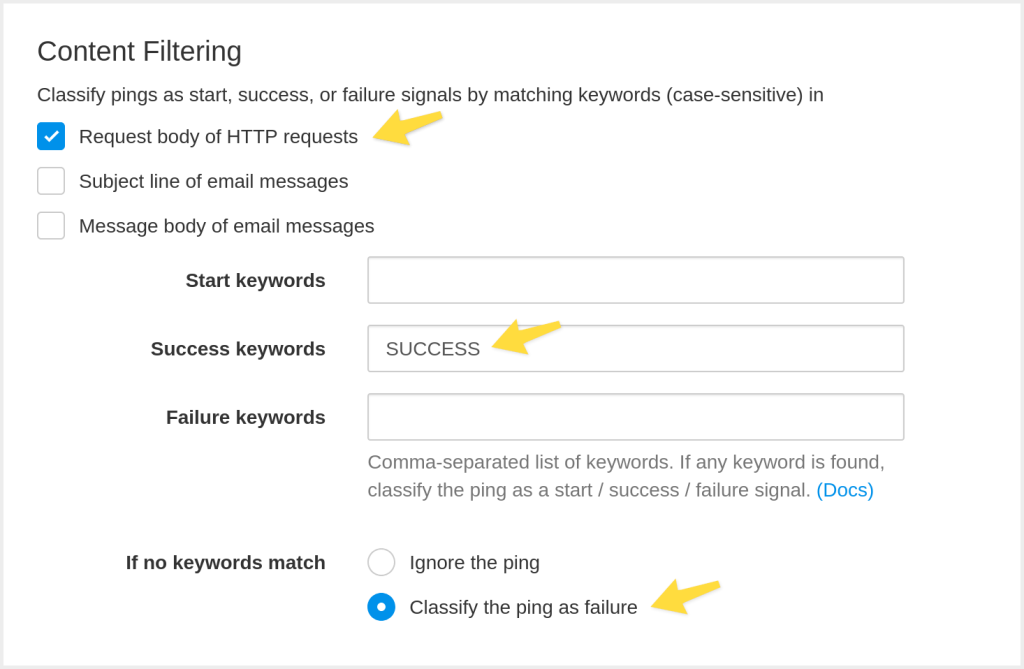
Healthchecks.io can now classify HTTP pings from clients as start, success, or failure signals not only by URL suffixes (no suffix, /start, /fail, /{exit-status}) but also by looking for specific keywords or phrases in the HTTP request body. The content filtering feature was already available for email pings, and now it has been extended to HTTP pings as well.
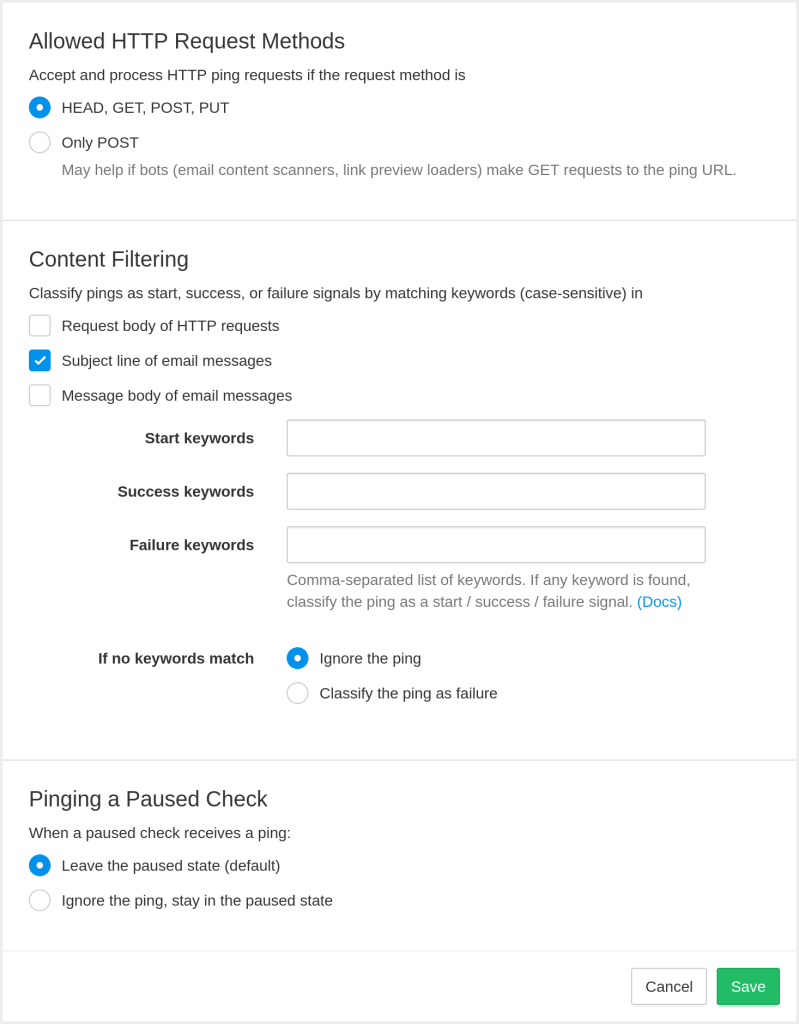
You can configure the keywords in each check’s details page, “Filtering Rules” dialog:
You can also configure the filtering rules via the API: see the new filter_http_body and filter_default_fail parameters for the Create Check and Update an Existing Check API calls.
The second new addition in the “Filtering Rules” dialog is the “If no keywords match” option. It lets you specify how Healthchecks.io should handle pings where no configured keywords match. The default is to ignore such pings (they will still show up in the event log with an “Ignored” label, but they will not affect the check’s status). And the other option is to classify such pings as failure signals. You can, for example, have a configuration that classifies requests with the string “SUCCESS” in the request body as success signals and all other requests as failure signals:
The Nitty Gritty Details
Healthchecks.io stores only the first 100 kB of each ping request’s body. If keyword filtering is active, it also only looks for the keywords in the first 100 kB of the request body. If a client sends a larger request, and the matching keywords are at the end, Healthchecks.io will not see them.
You can specify multiple keywords in each keyword input field by separating them with commas. This means the keywords themselves must not contain commas. If you specify multiple keywords, Healthchecks.io will check whether any of them match (not if all of them match).
The keyword matching is case-sensitive. “error”, “Error”, and “ERROR” are three different keywords.
You can use phrases with spaces in the keywords fields (for example, Backup successful), but be careful with spaces as whitespace matters. You cannot use multi-line strings in the keywords fields.
Healthchecks.io applies filtering rules in a specific order, stopping at the first step that matches:
The “Pinging a Paused Check” setting: If a check is paused and is configured to ignore pings while paused, Healthchecks.io will ignore the ping.
The “Allowed HTTP Request Methods” setting: If a check is configured to only accept HTTP POST requests, and the HTTP request is not a POST request, Healthchecks.io will ignore the ping.
The failure keywords. If any are found in the first 100 kB of the request body, Healthchecks.io will classify the ping as a failure signal.
The success keywords. If any are found in the first 100 kB of the request body, Healthchecks.io will classify the ping as a success signal.
The start keywords. If any are found in the first 100 kB of the request body, Healthchecks.io will classify the ping as a start signal.
If keyword filtering is enabled for HTTP requests, but no keywords match, Healthchecks.io will either ignore the ping or classify it as a failure signal, depending on the If no keywords match configuration option.
URL suffix. Finally, Healthchecks.io will classify the ping as success, start, or failure signal based on the URL suffix (no suffix, /start, /fail, or /{exit-status}).
When is this Useful?
Filtering by keywords can help if you are monitoring a system that sends webhook requests to a single URL, but with varying payloads. To monitor such a system, previously you would have needed an extra component (a Lambda function, a microservice, …) that inspects the webhook’s payload and calls the appropriate Healthchecks.io ping URL. With the keyword filtering feature, the extra component may no longer be necessary.
The “If no keywords match, classify the ping as failure” option is useful when you know for certain that a success ping will contain a specific keyword in the request body, but you do not know all the different error responses that could be returned in case of an error.
Between November 1, 23:30 UTC and November 2, 1:10 UTC, Healthchecks.io (both the main website, healthchecks.io, and the ping endpoints, hc-ping.com) had intermittent connectivity issues in the form of some requests taking multiple seconds to finish, or timing out entirely. Usually, such symptoms are caused by infrastructure problems out of our control, but this time the problem was on our side: our load balancers were running out of available connection slots. Our load balancers were dealing with a flood of ping requests from a misconfigured client. The load balancers were using the “tarpit” rate-limiting to slow the client’s requests down. Unfortunately, this did not work as intended: the client did not slow down, but the load balancers were hitting their connection count limits and rejecting legitimate requests.
Timeline
November 1, 23:24 UTC: ping requests for a single, specific UUID increase from 10 requests/second to sustained 300 requests/second.
November 1, 23:39 UTC: one of the load balancers starts rejecting connections and gets automatically removed from DNS rotation. This increases the load on the remaining load balancers and starts a chain reaction.
November 2, 00:11 UTC: I get woken up by blaring notifications and start an investigation.
November 2, 01:06 UTC: I have identified the offending client IP addresses (a single IPv4 address and a /64 IPv6 subnet), and update the load balancer configuration to reject TCP requests from them. Things go back to normal.
November 2, 08:40 UTC: To avoid similar issues in the future, I update the load balancer rate-limiting configuration to return HTTP 429 immediately and not use the “tarpit” method.
Tarpit
Healthchecks.io uses multiple levels of rate-limiting to prevent a ping flood from overloading our database:
On load balancer servers, HAProxy applies the initial, lax rate limiting. It proxies the good requests to NGINX running on application servers.
On application servers, NGINX applies more strict rate limiting and geo-blocking. It proxies the good requests to the application.
When a client exceeds the configured rate limit, HAProxy gives several options on how to handle the client’s request:
Deny (http-request deny): return a HTTP 429 “Too Many Requests” response to the client.
Tarpit (http-request tarpit): wait for a bit, and only then return HTTP 429 to the client. During the wait period, a network socket is tied up.
Silent drop (http-request silent-drop): immediately disconnect without notifying the client, so the client continues to wait.
Reject (http-request reject, tcp-request content reject, and tcp-request connection reject): immediately disconnect, but do not force the client to wait.
Each method has its pros and cons.
“Deny” is the most polite, but also the most expensive in case of an attack. For each request, the server has to do a full TLS handshake, parse the HTTP request, and send an HTTP response.
“Tarpit” can slow down clients that make requests sequentially, but can overwhelm the load balancer if clients make huge amounts of requests in parallel.
“Silent drop” forces the client to wait and does not tie up the server’s resources, but may be too aggressive in cases where the client is merely misconfigured and not intentionally malicious.
“Reject” is cheaper to process than “Deny” but does not inform the client about why the connection was rejected.
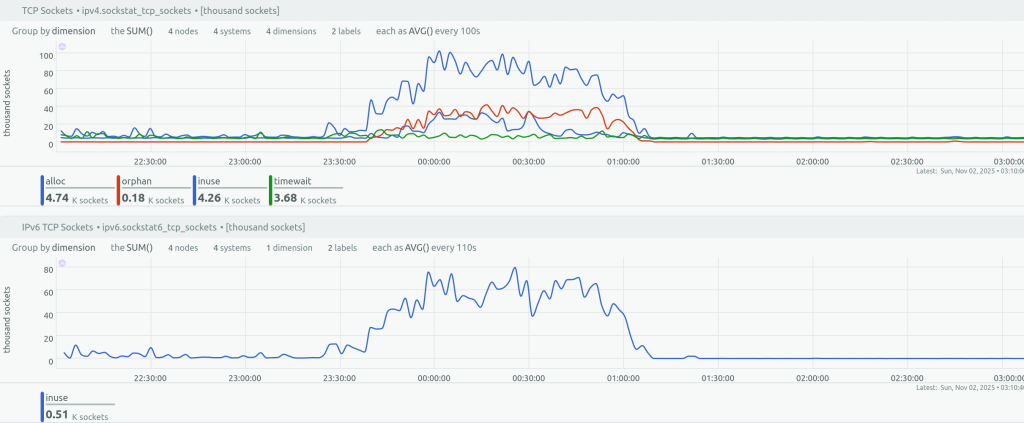
Our HAProxy servers were configured to use the tarpit method to rate-limit particularly spammy clients. To reduce the risk of running out of connection slots, the wait time was set to 1 second. Unfortunately, in this case, the waiting period did not slow the client down, and the request rate was high enough that the HAProxy servers did indeed start to hit the connection slot limits.
Netdata monitoring graph showing the aggregate number of open IPv4 and IPv6 sockets on the load balancer servers.
The Fix
After figuring out what was happening, my immediate fix was to block the specific offending IP addresses using the “Reject” method. Later in the day, after gaining a better understanding of the problem, I updated the HAProxy configuration to use the “Deny” method to reject rate-limited requests. One more lesson learned.
Update on November 5, 2025
In the past couple of days, I have made a few additional changes in addition to switching away from using the “tarpit” method:
In the HAProxy configuration I added previously missing timeout http-request 5s. This guards against Slowloris attacks. This outage was not caused by a Slowloris attack (in fact, it was more like a “reverse Slowloris”: the server, rather than the client, was adding the pauses), but Slowloris attacks can also cause connection slot exhaustion, and are easy to perform.
I increased the maxconn parameter in HAProxy configuration to give the load balancers some more breathing room.
I updated the rate-limiting rules to cover both hc-ping.com and hchk.io endpoints (previously, only hc-ping.com was being rate-limited at the load balancer level).
I added a new alerting rule in Netdata agents to notify me when the number of active HAProxy frontend sessions passes specific thresholds (well below the maxconn value).
I tweaked the HAProxy logging format to make the logs easier to use.
I am sorry for the false monitoring alerts and the confusion caused by this incident. –Pēteris
Due to the nature of cron jobs, our ping endpoints (https://hc-ping.com/... URLs) receive spiky traffic:
On average we write ~500 ping requests/second to the database.
At the start of every minute, we write around 4000 pings/second.
At the start of every hour, we write over 10’000 pings/second.
The Healthchecks open-source project includes a fully functional, tested and type-annotated ping handler written in Python. On self-hosted Healthchecks instances, when you send an HTTP request to a ping URL, a Django view collects and validates information from the request, then uses Django ORM to update a Check object in the database and insert a Ping object in the database. This approach is good for tens to low hundreds of requests per second, depending on hardware. For example, on my dev machine (Intel i7-9700K CPU, NVMe SSD, PostgreSQL runs locally on the same machine), using uWSGI as the web server, and benchmarking with wrk, Healthchecks can serve about 250 ping requests per second.
In the name of efficiency, since nearly the beginning, hc-ping.com endpoints run an alternative closed-source ping handler written in Go. The Go app used to work like this:
HTTP handler collects and validates information from the request, and puts a Job object on a queue (a buffered Go channel)
A worker goroutine runs a loop which reads a Job object from the channel, and calls a PostgreSQL stored procedure which executes the required SELECTs, UPDATEs, INSERTs, and DELETEs.
In the production environment, the database runs on a separate server with around 1ms network latency. Pings are processed sequentially over one database connection. However, due to using a stored procedure that encapsulates multiple SQL operations, in simple cases, there is only one round-trip to the database per ping request.
If we imagined the worker goroutine as a coal mine, the database as a power station, and a database transaction as a train, we could illustrate this in OpenTTD like so:
This setup was working quite well! As the volume of pings gradually grew, in 2021, I updated the app to use two worker goroutines reading from the same Jobs channel:
In 2024, I increased the worker count to three, and in 2025 to four. With three physical servers running the Go app, there were a total of 3*4=12 sequential processes writing ping requests to the database. With the current hardware and network, they could cumulatively achieve around 5000 requests per second.
Batching, First Attempt
To increase ping processing throughput, in 2024, I investigated a batching idea. The idea was to collect multiple Job objects in a batch, pass them as an array to another stored procedure, which would iterate over them and call my existing stored procedure for each. I prototyped the idea and even deployed it to production for a short period, but ultimately switched back to the previous approach. The reasons for switching back were:
Things were getting quite complex. I had to use an array of a custom composite type to pass data to PostgreSQL. Passing data back from the stored procedure was also getting tricky. Debugging issues in PL/pgSQL was getting tedious with stored procedures calling other procedures several levels deep.
The performance of the new version was not that much better. I no longer have specific measurements, but there was only a mild improvement in throughput.
I found a serious bug in the code, and had to roll back to the previous version in a hurry. Rather than fixing the bug, I later decided to scrap the idea.
Batching, Take Two
In the back of my mind, I kept mulling over the batching ideas. I had read in the pgx documentation that COPY can be faster than INSERT with as few as five rows. As a performance optimization junkie, I was very tempted to find a way to use it. I also wanted to move processing and conditional logic from the stored procedure to the Go code. Web servers scale horizontally, but the database is a bottleneck, at least for writes. Anything that can be done outside the database should ideally be done outside the database.
Over the course of a month, I put together a new version:
HTTP handler collects and validates information from the request, and puts a Job object on a queue (a buffered Go channel).
A worker goroutine reads Jobs from the channel and assembles a Batch. It reads jobs until it either reaches a batch size limit (currently 100 items) or a timeout (currently 5 ms).
The worker then starts a database transaction and passes the assembled batch to a separate routine, which:
SELECTs the needed data from the database (using a single SELECT for all items in the batch)
UPDATEs the checks in the database (a separate UPDATE per batch item, but the queries are pipelined)
Inserts pings using the COPY protocol (a single COPY operation for all items in the batch)
The worker then commits the transaction.
In terms of OpenTTD:
Of course, there were additional details and special cases to take care of, including:
When pinging by slug, check IDs need to be looked up by slug and ping key.
When using auto provisioning, checks may need to be created on the fly.
Jobs need to be sorted in a consistent order to avoid deadlocks between concurrent transactions.
Old pings need to be regularly cleaned up. However, this does not need to hold up HTTP request processing and can be done in a separate goroutine over a separate database connection.
If a database connection goes bad mid-transaction, the app must be able to reconnect and re-run the transaction without losing or duplicating any pings.
The new version of the app no longer uses stored procedures and instead runs regular SQL queries. I could still, in some cases, combine several queries into one by using common table expressions (WITH clauses) and/or subqueries.
For correctness testing, I reused the same Django tests that the Python version of the ping handler uses. I adapted them to make real HTTP requests to the Go app instead of using Django’s test client.
Batching, but with Two Workers
The batching strategy trades some latency for better throughput. To improve the median latency, I reintroduced the multiple workers idea: while one worker is submitting a batch to the database, another worker can already be assembling the next batch. To prevent worker goroutines from racing each other, I used a mutex to allow only one worker to assemble a batch at any given time. OTTD time:
This is the version currently serving requests on hc-ping.com. From the logs, I see it handles traffic spikes of over 11’000 requests per second, with no significant backlog forming. I have not benchmarked the production environment, but when benchmarking on my dev system, it achieved over 20’000 requests per second.
Lifecycle Of a Ping Request
Here’s an overview of the processing steps each ping goes through in the current setup:
Client makes a HTTP request to an https://hc-ping.com/... URL or sends an email to an ...@hc-ping.com email address.
The request arrives at one of our HAPoxy load balancers. The load balancer applies the initial, lax rate limiting and tarpits particularly spammy clients. It proxies the good requests to NGINX running on application servers.
NGINX applies more strict rate limiting, and also applies some geo-blocking. It proxies the good requests to the Go app
The Go app’s HTTP handler assembles a Job object and checks if it is not in the “404 cache”. Sidenote about the 404 cache: when a client pings a check that does not exist, the Go app returns a 404 response and also caches this fact. This way, the app can respond to subsequent requests for the same URL without hitting the database. We can do this optimization only for UUID URLs and not slug URLs, because UUIDs are assigned randomly, and clients cannot pick them. If a check with a given UUID does not exist now, we can relatively safely assume it will also not exist a minute, an hour, or a year later. The HTTP handler puts the good Job objects in a queue.
One of the worker goroutines picks up the job from a queue and adds it to a batch. When a batch is assembled, the worker starts a database transaction and executes a series of SELECT, UPDATE, COPY SQL commands to process the entire batch as a single unit. After it commits the transaction, the ping is in the database.
Next Steps For More Throughput
What happens when we need more throughput? A couple of thoughts:
Year by year, CPUs and NVMes are still getting faster. The servers Healthchecks.io is running on now are much faster than the servers we started with 10 years ago. We are not yet on the fastest reasonably available hardware; there is still room for vertical scaling.
Likewise, every major version of PostgreSQL is adding new optimizations and is getting incrementally faster.
I can likely eke out some additional throughput by tuning the maximum batch size and the worker count. And by tuning PostgreSQL configuration. And by using slightly more aggressive rate limiter settings.
When the above is not enough and we still need more throughput, the request backlogs will take longer and longer to clear after each traffic spike. When the average request rate creeps above what the system can handle, things will start to fall apart. I will need to have a scaling solution ready well in advance of that time.
On April 30, starting from 15:46 UTC, Healthchecks.io was unavailable for about 30 minutes. The outage was caused by, most likely, hardware instability on the database server. The PostgreSQL server crashed with a segfault, and a little later, the entire server stopped responding to pings. The system recovered after a manual reboot. Afterward, I migrated the database to new hardware to reduce the chance of a similar incident in the future.
Timeline
April 30, 15:30: Netdata monitoring shows first deviations from steady state in temperature, CPU usage, and IO activity on the database server.
April 30, 15:36: PostgreSQL logs a segfault in system logs.
April 30, 15:46: The database server completely locks up. I start receiving monitoring notifications but am away from my work computer.
April 30, 16:05 I arrive at the work computer and trigger a hardware reset on the database server. The server boots back up and resumes operation.
May 1, 7:00: I provision and start setting up replacement database servers (both primary and standby).
May 2, 7:25: I fail-over to the replacement database server.
Immediate Response
When monitoring notifications started, I was at a playground with kids, about 15 minutes away from my main work computer. I had a laptop with deployment tools with me. The tools were not fully up to date, and I decided it was safer and not much slower to drive back to the main work computer.
After arriving at the main computer and finding out the database server does not respond to pings, I triggered a hardware reset for it. The alternative option was immediately promoting the standby server as the new primary. Trying a reboot first could cost time and extend the outage if it didn’t work, but would be safer if it did work. At this point, I didn’t know yet if the control plane worked and if I could disable the old primary reliably. The old primary coming back before its IP is removed from client DB configurations would get the system in a split-brain scenario.
Investigation
System logs showed a segfault (timestamps are UTC+2):
Apr 30 17:36:40 db3 kernel: postgres[2431248]: segfault at 0 ip 0000000000000000 sp 00007fff179fb4e8 error 14 in postgres[589f9d235000+dc000] likely on CPU 6 (core 12, socket 0)
Apr 30 17:36:40 db3 kernel: Code: Unable to access opcode bytes at 0xffffffffffffffd6.
After reboot, “smartctl -a” showed no logged NVMe drive errors on either of the two drives. “cat /proc/mdstat” showed both RAID drives being up and healthy.
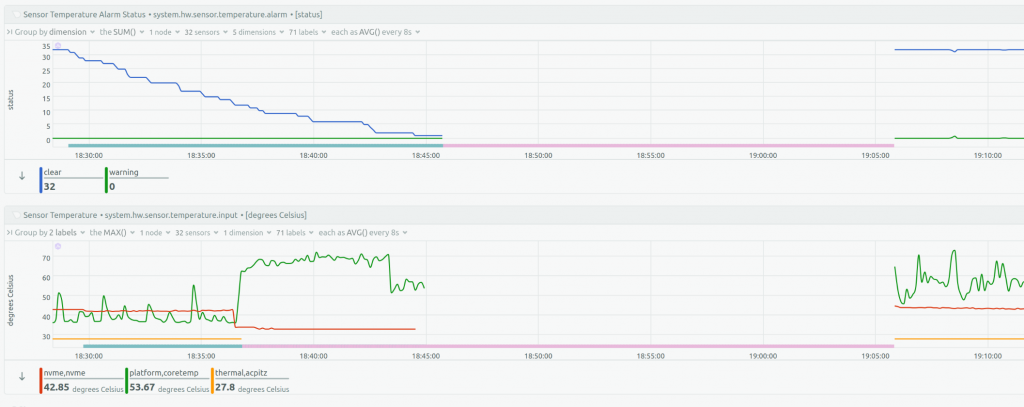
Netdata graphs showed various anomalies that started about 15 minutes before the complete system lock-up. Here’s a graph showing CPU temperatures jumping and NVMe temperatures dropping about 10 minutes before the lock-up (timestamps are UTC+3):
My assumption is that the underying cause was hardware instability. I didn’t spend too much time looking for the exact cause but instead focused on preparing a replacement server, as debugging and experimenting with a live production machine was not an appealing option.
Migration to New Hardware
Healthchecks.io runs on Hetzner bare metal servers. The old database servers, primary and standby, were running on EX101 machines: Intel Core i9-13900, 64GB ECC RAM, and 2×1.92TB NVMe drives. I wanted different hardware, different in as many aspects as possible, and selected EX130-S:
CPU: Intel Xeon 5412U, presumably and hopefully higher quality than consumer-class Intel Core i9.
RAM: 128GB ECC RAM. Higher capacity, so there is a chance the RAM sticks are a different model.
Storage: 2×3.84TB NVMe. Higher capacity, so guaranteed different model than EX101.
I baked the servers with stressapptest for two hours and verified no corrected ECC errors. I then installed OS and used my existing deployment scripts to set up PostgreSQL and start data replication. After a day of operation and monitoring, which showed no issues, I performed a DB fail-over to one of the new servers.
In Closing
In the current hosting setup, the database is a single point of failure. If a web server fails, the load balancers remove it from rotation in a couple of seconds. If a load balancer fails, a watchdog service removes it from DNS rotation, and DNS changes propagate in a couple of minutes. But if the primary database fails, I have to fix it manually. I am still not confident I can make an automatic fail-over process that handles all the partial outage cases better than a manual process. Therefore, my aim is to make database outages as infrequent and short as possible.