But in some scenarios, you may want to have multiple apps on the same domain, each under its own path:
https://example.org/hc
When this feature request first came up, I fixed various bits of the codebase to get the basics working. The main areas of work were:
HTML templates: add path prefix to URLs, do not use hardcoded URLs.
JavaScript: add path prefix to URLs in AJAX calls.
Python: make sure the URLs generated with django.urls.reverse() include the path prefix.
Application code can figure out the path prefix from request headers in some cases but not all. The manage.py sendalerts and manage.py sendreports commands run outside the request-response cycle, and cannot access HTTP request data. My initial solution for determining the path prefix in management commands was to rely on the FORCE_SCRIPT_NAME Django setting.
With the initial fixes in place, it was technically possible to run Healthchecks on a subpath, but Healthchecks had no corresponding documentation besides the GitHub issue comments. Setting it up on any particular reverse proxy (Apache, nginx, Caddy, …) and WSGI server (uWSGI, Gunicorn, uWSGI inside Docker container) combination required some trial and error. WSGI has a standard mechanism for running an app under a path prefix – the SCRIPT_NAME variable, but each reverse proxy and each WSGI server has to be configured in its unique way to make use of it. Documenting and maintaining various configurations would be a nightmare task. And, remember, my primary goal is running Healthchecks.io. The self-hosted instances are a side objective.
I received a good tip from Florian Apolloner to ditch the reliance on SCRIPT_NAME and FORCE_SCRIPT_NAME, and instead inject the path prefix in Django URL patterns. I followed the advice and, starting from Healthchecks v3.8, you can serve Healthchecks on a subpath by adding a path prefix to the SITE_ROOT configuration parameter:
# This is how you usually set SITE_ROOT:
SITE_ROOT=https://example.org

# Bit since v3.8 this also works:
SITE_ROOT=https://example.org/hc
The reverse proxy can proxy URLs matching a certain prefix to the WSGI server without extra processing (such as rewriting the URL or setting SCRIPT_NAME). As an example, here is a configuration fragment for nginx (it would go inside a “server” block):
location /hc/ {
    include proxy_params;
    proxy_pass http://localhost:8000;
}
The preferred way to serve Healthchecks is at the root of the domain. But, if you need to serve Healthchecks under a path prefix, you can! Happy self-hosting, –Pēteris
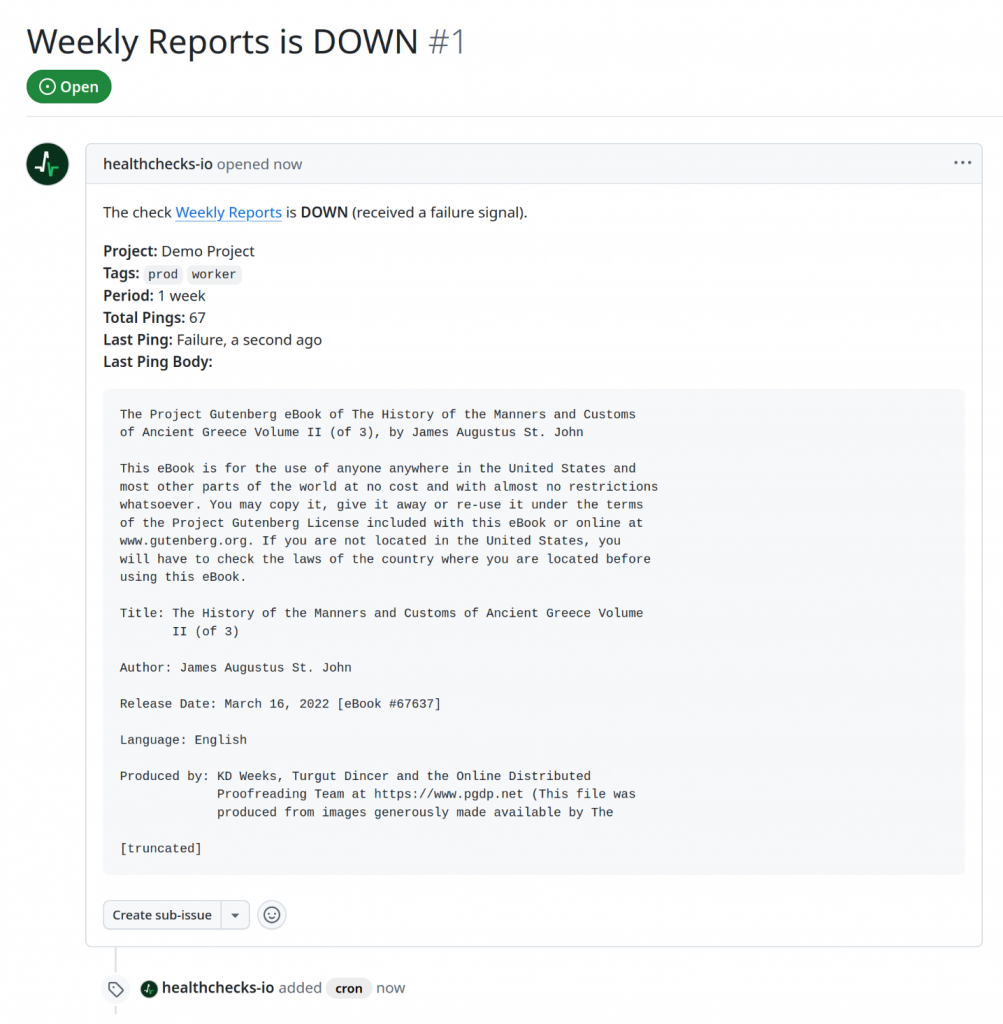
Healthchecks can now notify you about a failing check by opening a new issue in your chosen GitHub repository. Here is an example of how the GitHub issue might look:
The technical side of creating a new issue is straightforward: GitHub has an API call for creating an issue. You make an HTTP POST request with an access token in a request header and the issue title, body, and labels in the request body.
However, where do we get the access token from? The API call accepts three types of access tokens:
GitHub App user access tokens
GitHub App installation access tokens
Fine-grained personal access tokens
From the implementation perspective, personal access tokens would be the easiest to support. When the user sets up a GitHub integration, Healthchecks would guide the user through creating a personal access token with appropriate permissions, and ask the user to paste the personal access token in a form. But personal access tokens (PATs) have several drawbacks:
GitHub docs recommend PATs for short-lived scripts, bespoke developer-y things. GitHub docs recommend against using them in production apps.
PATs expire and need to be regenerated regularly.
PATs work on behalf of the user. The issues will appear as created by the user (not created by Healthchecks).
The end-user experience is not ideal. Regular users should not need to follow multi-step instructions to go into GitHub’s Settings > Developer Settings, pick permissions, and copy/paste cryptic strings around.
So I looked into GitHub Apps. Here, the developer first registers a GitHub app, with a logo, description, client ID, client secret, and other configuration settings. The developer can specify precisely what permissions the app will need: in our case, we need read-write access to repository issues and nothing else. When the user sets up a GitHub integration, they must install the GitHub App in their personal or their organization’s account. During app installation, the user can either grant the app access to all repositories or to specific repositories. There are two types of access tokens associated with GitHub Apps:
Installation access tokens. These tokens have a ghs_ prefix. If Healthchecks uses an installation access token, the issue will appear as created by Healthchecks (a bot user).
User access tokens. These tokens have a ghu_ prefix. These tokens let us perform actions on the user’s behalf, the issue will appear as created by the user.
Clearly, the installation access tokens seem like the right tool for the job. One lingering problem is that when a user is setting up a GitHub integration for a specific repository, how do we know if they have access to this repository? Consider the following scenario:
Alice sets up a GitHub integration for the repository alice/foobar. As instructed, Alice installs the Healthchecks GitHub app in their personal GitHub account.
Eve also sets up a GitHub integration for the repository alice/foobar. Eve does not have access to this repository. But, since the Healthchecks GitHub app is already installed in Alice’s account, Healthchecks does have access to this repository. Eve can now create issues in Alice’s repository.
Perhaps I did not look hard enough, but I did not find clear guidance about this potential security gotcha in GitHub documentation. I did find one StackOverflow question asking about the same issue. The solution I devised uses user access tokens during integration setup, and installation access tokens when creating issues. The integration setup flow is as follows:
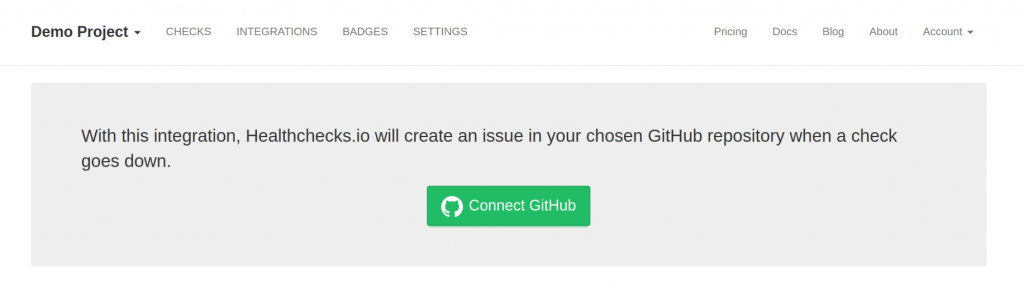
In Healthchecks, the user clicks on a “Connect GitHub” button:
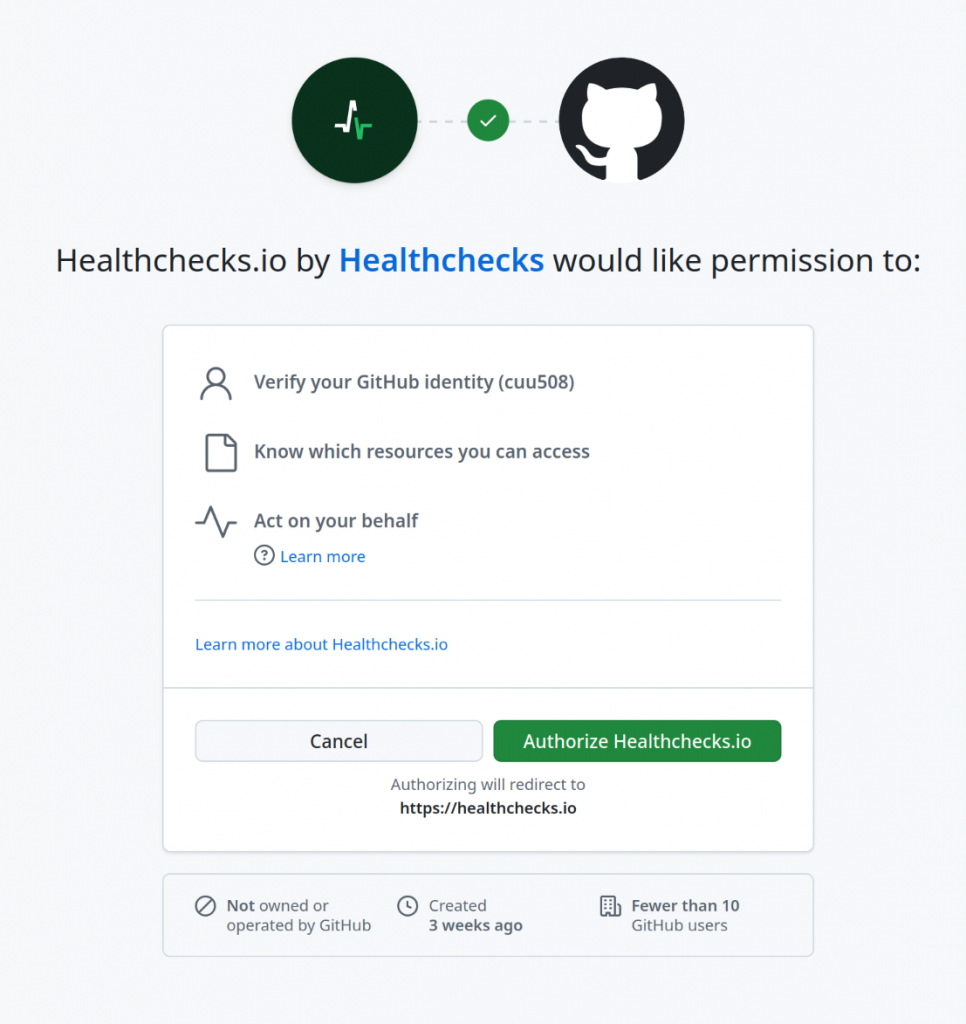
They are redirected to GitHub and asked to authorize the Healthchecks GitHub app.
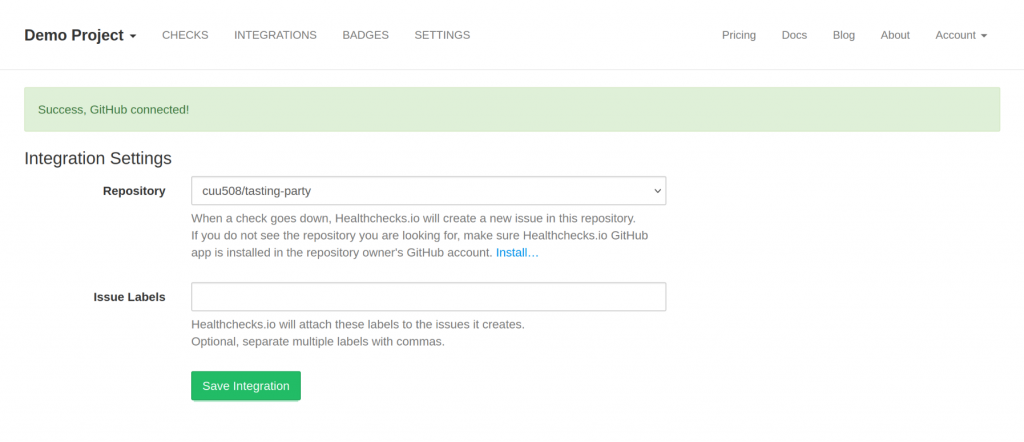
If the user follows through, Healthchecks acquires the user access token. Using the user access token, Healthchecks makes an API call to fetch the list of available repositories. If the list of repositories is empty, Healthchecks redirects the user to the GitHub App’s installation page:
Healthchecks asks the user to select a repository. When the user clicks “Save Integration”, Healthchecks checks if the selected repository was in the list of repositories retrieved from API. Therefore, Eve cannot smuggle Alice’s repository in:
After the integration is saved, Healthchecks forgets the user access token, and creates an installation access token each time it needs to create an issue.
The GitHub integration is live and ready for use on Healthchecks.io. But I am left with a thought: given how developers are often happy to jump on the first nominally working solution they can find, how many GitHub apps are out there where one user can impersonate another user (like Eve and Alice in the hypothetic scenario above)?
In any case, stay safe, and–happy monitoring! –Pēteris
Webhooks are a powerful way to notify external systems about checks changing state in Healthchecks.io. Webhook notifications are available to all user accounts, paid and free.
Webhooks were the second notification method supported by Healthchecks (the first one was email). The webhook delivery code started as a simple requests.get(user_supplied_url) and evolved. Today, the webhook integration in Healthchecks supports:
HTTP GET, POST, and PUT requests with user-defined request bodies.
User-defined request headers.
Placeholder values like $NAME and $STATUS that can be used in the URL, the headers, or the request body.
Separate webhook configurations for “check goes up” and “check goes down” events.
Retries when requests time out or return non-2xx status code.
In terms of implementation, none of the above is super complicated. When the user sets up a webhook integration, we collect the webhook configuration. When it is time to send a notification, we assemble the URL, the headers, and the request body, and pass them to our HTTP client library of choice. But two security-related aspects are a little more interesting:
We want to prevent webhook requests from accessing private IP addresses (10.x.x.x, 192.168.x.x, …).
Webhook targets can sometimes take a long time to respond. One user’s slow notifications should not block or delay another user’s normal notifications.
Private IP Addresses
Malicious users can set up webhook URLs to tamper with resources in the Healthchecks.io internal network. They can also set up DNS records that resolve to private IP addresses. So it is not enough to check for private IP ranges in webhook URLs using e.g. regular expressions.
I switched Healthchecks to using pycurl for making outbound HTTP requests. pycurl is a Python wrapper for libcurl, and libcurl lets you specify a CURLOPT_OPENSOCKETFUNCTION callback function. This function receives an IP address after DNS resolution, and can decide whether to connect to it or not.
Healthchecks has a site-wide configuration setting for enabling/disabling webhook requests to private IP addresses. This setting is disabled on the hosted service at Healthchecks.io. Operators of self-hosted Healthchecks instances, on the other hand, sometimes specifically need webhooks to access services running inside their internal network, and they can enable it.
When migrating Healthchecks from requests to pycurl, I wrote a wrapper for pycurl that mimics the requests API, and thus could be used as a drop-in replacement. It does not cover the full functionality of requests, but it does cover the functionality that Healthchecks uses.
Slow Webhook Targets
Users can set up webhooks to targets that take a long time to respond, and then generate frequent notifications to these targets. Doing so would keep the notification-sending process busy and delay notifications for all other users. Users could do this maliciously, but this could also happen (and has happened) unintentionally.
The first obvious mitigation was to implement a time budget for each webhook delivery: if a webhook delivery (including retries) takes too long, we abort it.
Another mitigation was to prioritize notifications to integrations with lower historic send times. If we have multiple deliveries lined up, start with the quick ones, and do the slow ones last.
The notification sender is implemented as a Django management command (“manage.py sendalerts”). A simple way to increase sending capacity would be to run multiple “sendalerts” processes concurrently. This works, but each process needs at least one database connection. I am not running PgBouncer (and want to delay introducing new infrastructure pieces for as long as possible), so I cannot go too crazy with many concurrent “sendalerts” processes.
A few weeks ago I completed work on another idea to increase the sending capacity. The “sendalerts” process now uses multiple worker threads to send notifications. The worker threads share database connections using psycopg3 connection pool, which Django recently added support for. There can be more worker threads than database connections available in the pool, but the worker threads are programmed to return DB connections to the pool before potentially long network IO operations, allowing other threads to advance. With an appropriately set worker count, this allows hundreds of in-progress webhook requests while using only a few DB connections.
After implementing the worker threads, I removed the prioritization by historic send time. I also increased the timeout value for outbound HTTP requests as now I could afford to! The timeout is currently set to 30 seconds, and Healthchecks retries failed requests up to 2 times. So a single delivery can take up to 3 * 30 = 90 seconds.
Closing Notes
Healthchecks.io now uses the threaded notification sender for delivering all notification types, not just webhooks. There are integration types other than webhooks that are sometimes slow. For example, Signal and MS Teams notifications sometimes take multiple seconds to complete. The above changes benefit all integration types, not just webhooks. Webhooks, however, are the most risky, as they can be fully configured by users.
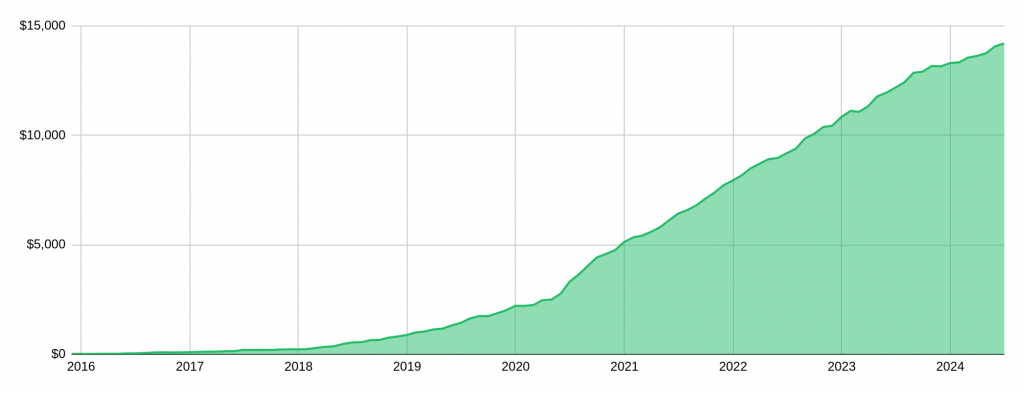
Healthchecks.io currently has 652 paying customers, and the monthly recurring revenue is 14043 USD. MRR graph:
Side note: to minimize the number of data sub-processors, I am not using revenue analytics services. I used a script and a spreadsheet to make the MRR graph!
I’m happy to see MRR gradually go up, but I’m not optimizing for it. Healthchecks.io is sustainable as-is, and so I’m optimizing for enjoyment and life/work balance.
Yes, Healthchecks.io is still a one-man business. Until 2022, I was part-time contracting. Since January 2022 Healthchecks.io has been my only source of income, but I work on it part-time.
At least for the time being I’m not looking to expand the team. A large part of why I’m a “solopreneur” is because I do not want to manage or be managed. A cofounder or employee would mean regular meetings to discuss what’s done, and what’s to be done. It would be awesome to find someone who just magically does great work without needing any attention. Just brief monthly summaries of high-quality contributions, better than I could have done. But I don’t think I can find someone like that, and I also don’t think I could afford them.
Growth Goals
I’m not planning to tighten the limits of the free plans. I started Healthchecks in 2015 because I thought the existing services (Dead Man’s Snitch and Cronitor) were overpriced. I started with “I think this can be done better and cheaper”, and I’m sticking with it.
For the same reason, I’m also not planning to raise pricing for paid plans.
I’m choosing not to pursue enterprise customers who ask about PO billing, payments by wire transfer, custom agreements, and signing up to vendor portals. “But you are leaving money on the table!” – yes, it is a conscious decision. In my situation, the extra money will not make a meaningful difference, but the additional burden will make me more busy and grumpy.
Feature-wise, I am happy with the current scope and feature set of Healthchecks. I am not planning to expand the scope and add e.g. active uptime monitoring, hosted status pages, or APM features.
Healthchecks the product is hobbit software and Healthchecks.io the business is a lifestyle business.
Hosting Setup
The hosting setup is mostly the same as in 2022. Just a few updates:
Web servers upgraded to Hetzner’s AX42 (AMD 8700GE, 8 cores). On the old machines, saw a few nonsensical Python exceptions. A kernel update and a reboot didn’t fix it. Rather than messing with hardware troubleshooting, I upgraded to newer, faster, and more efficient machines.
Database servers upgraded to Hetzner’s EX101 (Intel 13900, 8+16 cores). I was setting up new database replicas after an outage and failover event and took the opportunity to upgrade hardware.
That’s it for now, thank you for reading! Here’s to another 9 years, and in the closing here’s a complimentary picture of me trying to fit through pull-up bars, and my kids, Nora and Alberts, cheering:
On July 2, 2024 we received a notice from Twilio, our SMS provider, about a data leak involving IdentifyMobile, one of their downstream carriers. The downstream carrier had made an AWS S3 bucket public from May 10-15, 2024. The bucket contained message-related data sent between January 1, 2024, and May 15, 2024.
After requesting additional information, Twilio informed us that the leak included 13 SMS notifications sent by Healthchecks.io. The leaked data includes message body, recipient number, timestamp. Unfortunately Twilio could not determine which specific recipient numbers were impacted, but they knew only messages to France and Italy were impacted. On July 5, we notified all users with phone numbers in the affected regions, 40 accounts.
Q: I received “Notice of Security Incident With SMS Notifications” from Healthchecks. Is there anything I should do?
Your Healthchecks.io account is not compromised, no need to change its password.
You could consider switching from SMS to a different notification method which does not require your phone number, for example Pushover. No service is immune to security incidents, but if they do not have your phone number in the first place, they cannot leak it.
Q: Why did you notify 40 accounts if only 13 messages were exposed?
Twilio provided a list of exposed message IDs, but not the associated phone numbers. We cannot associate message IDs with phone numbers, because we have configured our Twilio account to retain message logs for only 7 days. We had selected the relatively short log retention period, ironically, to minimize the damage in case the message logs somehow leaked.
We asked Twilio support to request the recipient phone number data from IdentifyMobile, as they presumably still have access to the data that was exposed. According to Twilio, IdentifyMobile are “currently unable to share the requested information due to the sensitive nature of it”.
Timeline
May 10, 2024: IdentifyMobile makes AWS S3 bucket containing sensitive data public.
May 15, 2024: IdentifyMobile fixes the leak.
July 2, 2024: Twilio sends a notice of security incident to its customers.
July 3, 2024: We request additional information from Twilio support.
July 4, 2024: Twilio support clarifies what information was exposed, and provides a list of the 13 exposed message IDs.
July 5, 2024: We send a notice of security incident to the 40 potentially affected users.
July 5, 2024: We ask Twilio support to request recipient numbers from IdentifyMobile. On the 3rd attempt, Twilio agrees to do it.
July 10, 2024: Twilio support informs us IdentifyMobile cannot share the requested information.
July 11-16, 2024: We ask Twilio support followup questions about plans to audit their other carriers and sub-carriers, and receive non-specific answers.
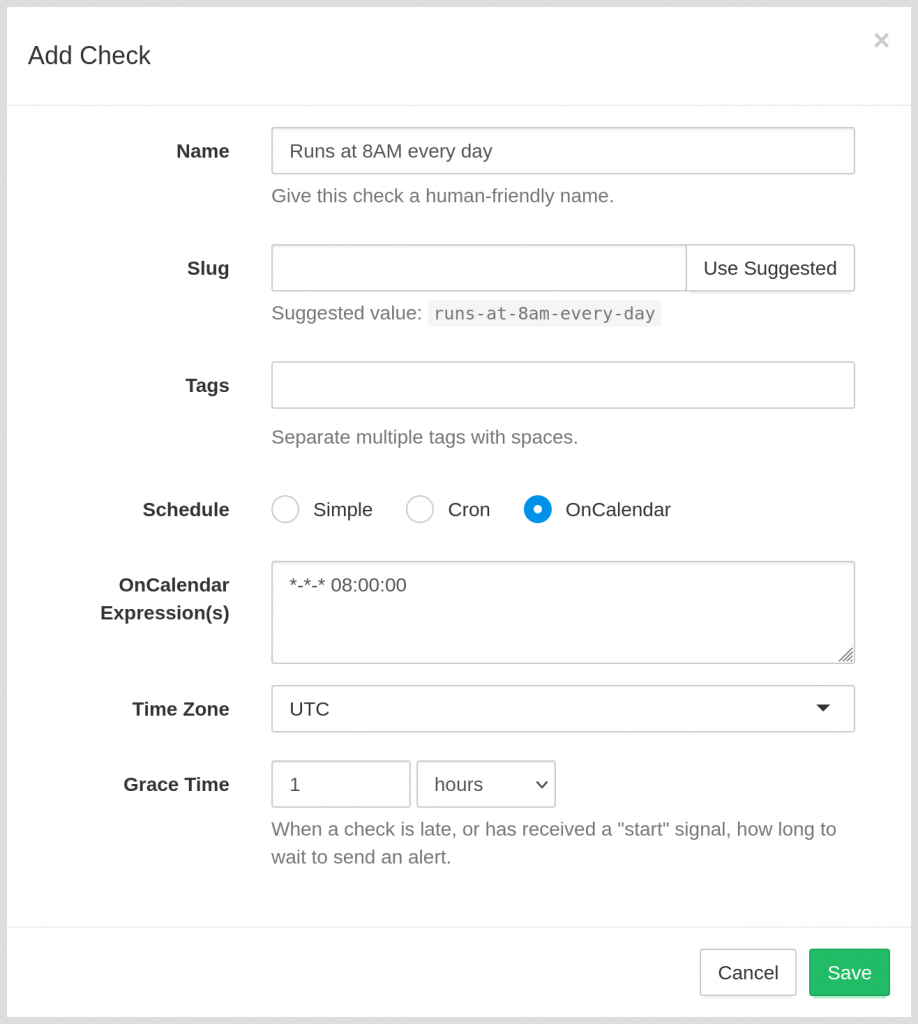
Healthchecks now supports OnCalendar schedules, used for scheduling tasks with systemd timers. Here’s what’s new: when creating a check, you can now switch between “Simple”, “Cron” and “OnCalendar” schedules:
You can also edit schedules (and switch schedule types) for existing checks:
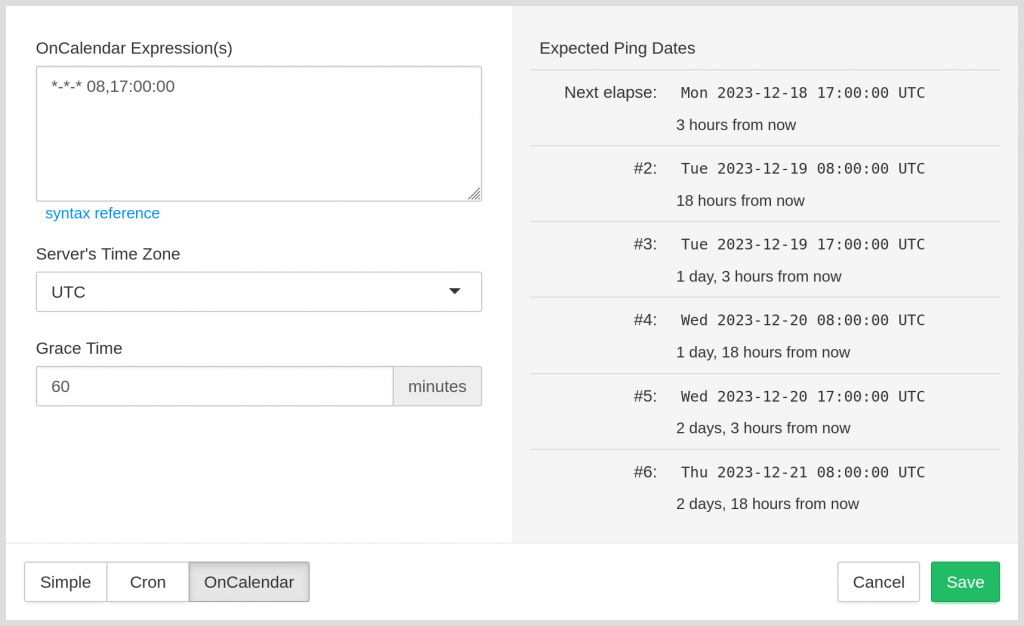
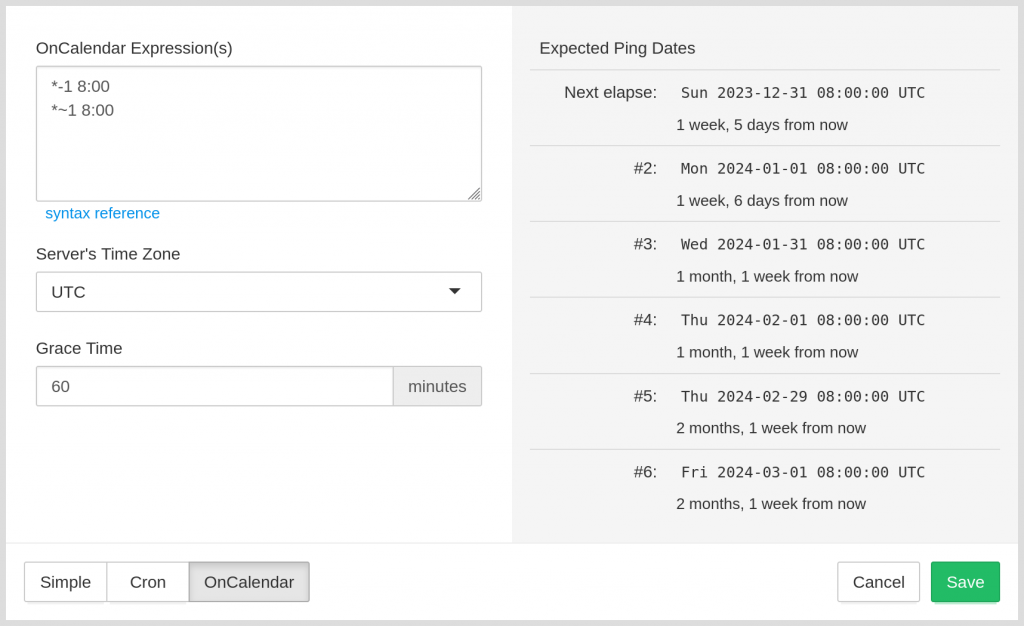
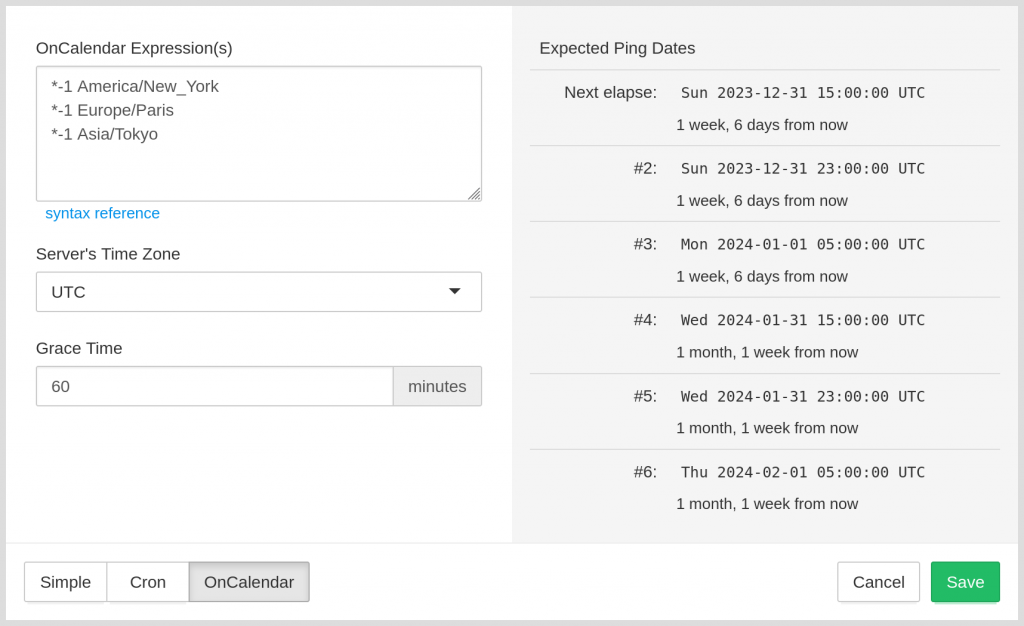
The UI control for entering the schedule is a multi-line textbox, and yes, you can specify multiple schedules there – Healthchecks will expect a ping when any schedule matches:
Note: the schedule field is currently limited to 100 characters. You will be able to enter 2-3 schedules, but probably not 10+ schedules.
systemd allows you to specify a timezone inside the OnCalendar expression. So does Healthchecks:
The API now supports OnCalendar schedules as well. You can pass either cron schedule or OnCalendar expression(s) in the “schedule” field for the Create a new check and Update an existing check calls, and Healthchecks will detect the schedule type automatically:
Under the hood, the OnCalendar schedule parsing logic is implemented in a separate “oncalendar” library. Feel free to use it in your own Python projects as well!
The OnCalendar schedule support is live on https://healthchecks.io and available to all accounts. Happy monitoring!
How I picked the services for comparison: I searched for “cron monitoring” on Google and picked the top results in their order of appearance.
Disclaimer: I run Healthchecks.io, so I’m a biased source. I’ve tried to get the facts right, but choosing what features to compare, and what differences to highlight, is of course subjective. When in doubt, do your own research!
Business Stats
Cronitor launched in 2014, is registered in the United States and runs on AWS. Cronitor is a bootstrapped company, and is operated by three friendly humans. Cronitor started as a cron monitoring service, but has expanded to website uptime monitoring, real user monitoring, and hosted status pages. Cronitor is a proprietary product and uses the SaaS business model.
Healthchecks.io launched in 2015, is registered in Latvia and runs on Hetzner (Germany). Healthchecks.io is a bootstrapped company, run by a solo founder. Healthchecks.io focuses on doing one thing and doing it well: alerting when something does not happen on time. Healthchecks.io is open source (source on GitHub), users can use the hosted service, or run a self-hosted instance.
Uptime Robot launched in 2010, is registered in Malta, and runs on Limestone Networks, AWS, and DigitalOcean. UptimeRobot started as a free website uptime monitoring service and added cron monitoring and hosted status pages support in 2019. After getting acquired in late 2019, UptimeRobot accelerated development and reorganized its pricing structure. Uptime Robot is a proprietary product and uses the SaaS business model.
Sentry launched in 2012, is registered in the United States and runs on AWS and Google Cloud. Sentry is a VC-funded company and has 200+ employees. Sentry started as an error tracking service, grew into APM, and launched cron monitoring support in public beta in January 2023. Sentry uses the SaaS business model, but its source code is available under the FSL license. Sentry is a complex product with many moving parts. Self-hosting is possible but is not trivial.
Pricing
Each reviewed service except Healthchecks.io bundles several products under one account:
Cronitor: cron monitoring, website uptime monitoring, RUM, status pages.
Uptime Robot: website uptime monitoring, cron monitoring, status pages.
Sentry: error tracking, APM, code coverage.
The total set of functionality you get from a paid account on each service is vastly different, so their pricing is not directly comparable. With that in mind, here is the pricing summary for each service, as of November 2023, for monitoring cron jobs specifically.
Cronitor
Free plan: monitor up to 5 jobs.
Business plan: $2/mo for 1 job.
Monitoring 100 jobs with Cronitor would cost $200/mo.
Healthchecks.io
Free plan: monitor up to 20 jobs.
Business plan: $20/mo for 100 jobs.
Business Plus plan: $80/mo for 1000 jobs.
Monitoring 100 jobs with Healthchecks.io would cost $20/mo. Healthchecks.io offers sponsored accounts for non-profits and open-source projects (details).
Uptime Robot
Solo plan: $8/mo for 10 jobs or $19/mo for 50 jobs.
Team plan: $34/mo for 100 jobs.
Enterprise plan: $64/mo for 200 jobs.
Monitoring 100 jobs with Uptime Robot would cost $34/mo. Uptime Robot offers sponsored accounts for charities and other non-profits (details).
Sentry
Sentry Cron Monitoring feature is currently in open beta. The limits for different pricing plans are not known yet. Sentry announced general availability and pricing in January 16, 2024.
Free: monitor 1 cron job for free.
Paid: $0.78/mo for 1 job.
Monitoring 100 jobs with Sentry would cost $77/mo. Sentry offers sponsored accounts for non-profits, open-source, and students (details).
Timeout-based Schedules
When using timeout-based schedules the user specifies a period (for example, one hour). The monitored system is expected to “check in” (send an HTTP request to a unique address) at least every period. When a check-in is missed, the monitoring system declares an outage and notifies you.
This monitoring technique is also sometimes called Heartbeat Monitoring. All four reviewed services support timeout-based schedules.
Cron Expression Schedules
The user specifies a cron expression (for example, “0/5 * * * *”) and a timezone. The monitoring system calculates expected “check in” deadlines based on the cron expression.
Supported by: Cronitor, Healthchecks.io, Sentry.
Not supported by: Uptime Robot.
Cronitor and Sentry use the croniter library to evaluate cron expressions. Healthchecks.io uses the cronsim library.
Start and Fail Signals
In addition to basic “I’m alive!” check-in messages, monitoring services typically support additional signal types:
“job started” signal: allows the measurement of job durations, and alerting when a job takes too long.
“job failed” signal: allows the job to explicitly declare itself as failed.
With this feature, clients can “check in” by sending an email message to a job-specific email address. This comes in handy when integrating with services that only support status reports via emails, or when working in restrictive environments where only email is allowed through.
With auto-provisioning clients can perform check-ins for jobs that the monitoring system does not yet know about, and the monitoring service registers the new jobs on the fly. Auto-provisioning is handy in dynamic environments where the set of monitored jobs changes frequently.
Cronitor provides first-party command-line client and SDKs for Java, JavaScript, Kubernetes, PHP, Python, Ruby, and Sidekiq. There are also third-party SDKs for Terraform and .Net.
Project Management, User and Team Management, Authentication
Cronitor
Cronitor supports organizing jobs into Environments. Within each environment, jobs can be grouped into groups. Jobs can be annotated with tags.
Cronitor supports multiple team members ($5/mo for each additional user). Team members can have “admin”, “user”, “readonly” roles.
Cronitor supports SAML2 SSO, which costs an extra $5/mo for every team member. Cronitor does not support two-factor authentication.
Healthchecks.io
Healthchecks.io supports organizing jobs into Projects. Jobs can be annotated with tags.
Healthchecks.io supports multiple team members with “owner”, “manager”, “user”, and “read-only” roles.
Healthchecks.io does not support any form of SSO. Healthchecks.io supports two-factor authentication using WebAuthn and using one-time codes (TOTP).
Uptime Robot
Uptime Robot does not support grouping or tagging jobs.
Uptime Robot’s higher-priced plans support multiple team members with “admin”, “read”, and “write” roles.
Uptime Robot does not support any form of SSO. Uptime Robot supports two-factor authentication using one-time codes (TOTP).
Sentry
Sentry supports organizing jobs into Projects and Environments.
Sentry supports multiple team members with “billing”, “member”, “admin”, “manager”, and “owner” roles.
Sentry offers many options for SSO: Google, GitHub, Okta, SAML2, and others. All options except Google and GitHub require the Business ($80/mo) billing plan. Sentry supports two-factor authentication using U2F, one-time codes (TOTP), and recovery codes.
Feature Matrix
Cronitor
Healthchecks.io
Uptime Robot
Sentry
Business registered in
🇺🇸
🇱🇻
🇲🇹
🇺🇸
Servers hosted in
🇺🇸
🇩🇪
🇺🇸
🇺🇸
Team size
3
1
10+
200+
Founded in
2014
2015
2010
2012
Jobs in the free plan
5
20
0
?
Price/mo for 100 jobs
$200
$20
$34
?
Self-hosting possible
❌
✅
❌
✅
Timeout-based schedules
✅
✅
✅
✅
Cron expressions
✅
✅
❌
✅
“start” and “fail” signals
✅
✅
❌
✅
Check-in via email
✅
✅
❌
❌
Auto-provisioning
✅
✅
❌
✅
Client SDKs
✅
❌
❌
✅
API
✅
✅
✅
✅
Projects
✅
✅
❌
✅
Team access
💰
✅
💰
✅
Single sign-on
💰
❌
❌
💰
Two-factor authentication
❌
✅
✅
✅
Notify via email
✅
✅
✅
✅
Notify via webhooks
✅
✅
💰
✅
Notify via Slack
✅
✅
💰
💰
Notify via Telegram
✅
✅
💰
❌
Notify via SMS
💰
💰
💰
💰
In Closing
If you notice any factual errors, please let me know (contacts), and I will get them fixed ASAP!
There are many more things to compare. If you are shopping for a cron monitoring service, you will have to decide what is important for you, and likely do some additional research.
Since a little more than two months ago, Healthchecks.io has been sending transactional email (~300’000 emails per month) through its own SMTP server. Here are my notes on setting it up.
The Before
Before going self-hosted, Healthchecks sent email using 3rd-party SMTP relays: AWS SES and later Elastic Email.
The reason for switching from AWS to Elastic Email was GDPR compliance: at the time United States did not have an EU adequacy decision, but Canada (the registration country of Elastic Email Inc.) did.
The primary reason I kept looking for alternatives to Elastic Email was also GDPR compliance: a country with EU adequacy decision is good, but being based in the EU is even better. Another reason was their poor communication during service outages: some outages were not acknowledged on their status page, there were no timely updates via support chat or otherwise, and there were no post-mortems published after outages. To their credit, Elastic Email did fix the outages reasonably quickly, and I was overall happy with the service in terms of functionality and pricing.
The EU-based SMTP Relay Options
There are few EU-based SMTP relay services. None of the big names (AWS SES, Sendgrid, Mailgun, Mailchimp, Postmark) are EU-based. I tested a few options:
EmailLabs: OK in terms of functionality and pricing. Judging by the mix of Polish and English in the user interface and documentation seemed geared primarily to the Polish market.
SMTPeter: OK in terms of functionality and pricing. It was probably just bad timing, but had a major outage while I was testing it. Small shop.
Brevo (formerly Sendinblue): the most prominent EU SMTP relay service. Has open and click tracking enabled by default, and refused to turn it off before seeing live production traffic, so a non-starter for me.
None of the options seemed like an upgrade over what I already had, and I kept circling back to the idea of self-hosting. The common wisdom is that self-hosting email means endless deliverability problems, but maybe-maybe?
The Self-Hosting Options
In May 2023, I spent several weeks researching and trialing self-hosted SMTP servers: mox, Postal, Haraka, Zone MTA, OpenSMTPD, and maddy. My brain was getting fried from jumping between documentation sites, trying to make sense of the feature sets, and the pros and cons of each project. One thing that helped immensely was reading Email explained from first principles – it filled many gaps in my knowledge of email delivery.
Maddy
After experimenting with and strongly considering OpenSMTPD, I ultimately picked maddy. I iterated on a test configuration until I got it to do the required things:
Accept email on port 465 from authenticated users.
Rewrite its envelope sender from “@healthchecks.io” to “@mail.healthchecks.io” (required for routing bounce messages back to the maddy server).
Sign it using DKIM protocol.
Put outgoing messages in a queue, attempt to deliver them, and retry with exponential backoff.
Deliver messages to remote MTAs from a single, specific IP.
When delivery fails, send a webhook notification to a designated webhook handler. For permanent failures, the handler can take appropriate action – unsubscribe a specific user from email reports, or mark a specific email integration as disabled.
Listen for incoming email on port 25.
When a remote MTA sends a DSN (delivery status notification, “bounce message”), deliver it to the same webhook.
Use an automatically provisioned LetsEncrypt certificate for TLS encryption on port 465 and port 25.
I wrote the provisioning scripts for deploying Maddy and its configuration to a server. I added and updated the required DNS entries for SPF and DKIM. I implemented, tested, and deployed the webhook handler that would receive bounce notifications from maddy.
IP Warm-Up
I spent several weeks gradually switching outgoing email traffic from Elastic Email to the self-hosted maddy server. IP warm-up serves two purposes:
Slowly builds up the reputation of the sending IP address. Switching the entire sending volume to a new IP address all at once risks getting blocked by the receiving servers.
It lets me test email delivery in the production environment and fix any potential problems with fewer negative consequences.
The Failover IP Oopsie
One issue I discovered during the IP warm-up phase was that the brand-new mail server (a Hetzner AX41 dedicated server) experienced minute-long network hiccups a couple of times per day. The cause could be a faulty NIC, a faulty switch, or a noisy neighbor, and the easiest fix is ordering another server and hoping for better luck. In anticipation of such a scenario, I had ordered a failover IP so I could keep using the already warmed-up IP with the new server.
I set up a new server, switched the failover IP to it, and after a few days of testing, no more network hiccups! So I went ahead and canceled the original machine. Then, a few days later, around 2 AM local time, my monitoring notifications went off: email delivery was broken. I had assumed that “failover IP” is more or less what other providers call “floating IP.” Dazed and confused in front of a blue screen in the middle of the night, I realized my misunderstanding and mistake: the failover IP is owned by a specific server. Canceling the server also cancels the failover IP with all its sender reputation.
To fix the immediate problem, I temporarily switched the web servers back to using Elastic Email as the SMTP relay. I asked Hetzner support if there was any way I could get the released IP back. Minutes later, I got a reply stating in perfect German calmness that my request would need to be handled by a different department during business hours. The next morning, Hetzner added the lost failover IP back to my account. Phew!
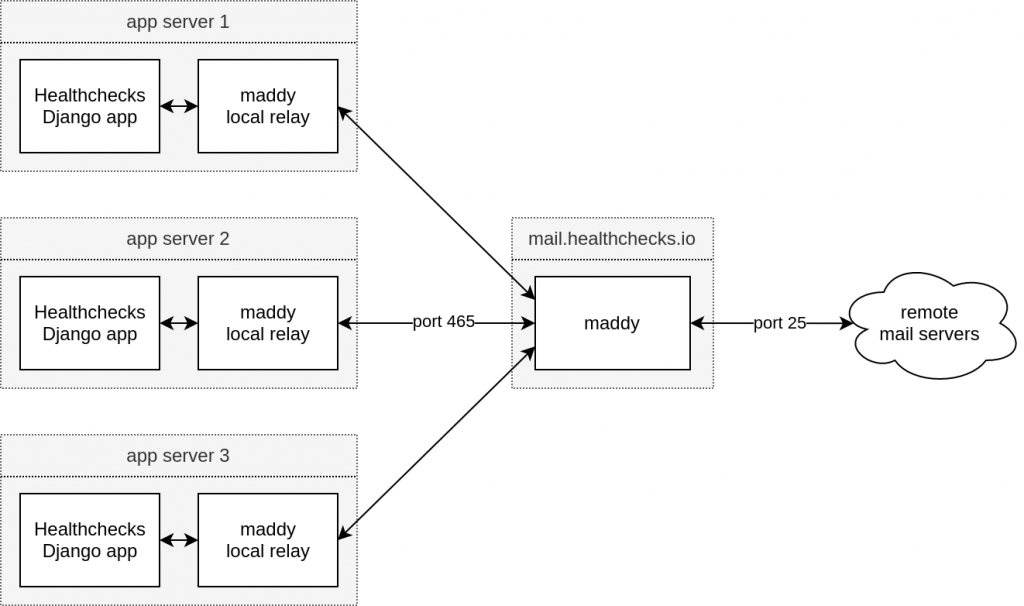
Local Relay-Only MTAs for Reliability
The internet-facing SMTP server (mail.healthchecks.io) runs on a single machine. Each app server also runs a local maddy instance which accepts outgoing email messages from local clients only, and hands them off to mail.healthchecks.io. If mail.healthchecks.io is unavailable (for example, during server restart), the local maddy instances queue the messages and retry them later.
Summary, Pros, and Cons
The self-hosted maddy server has been handling all Healthchecks.io transactional email for over two months. I am keeping an eye on bounce notifications, the outbound email queue size, and blocklists. So far, there have been no significant deliverability issues–fingers crossed!
Cons of going self-hosted:
Self-hosted SMTP server is another service to maintain. It uses up the limited time and mental bandwidth I have.
The inevitable deliverability problems will be my problems.
In the case of maddy, no pre-built graphical management and monitoring dashboard.
And pros:
Complete control of subprocessors with access to customer data (just Hetzner in my case).
Complete control over server configuration.
Fixed direct costs (as long as a single server can keep up with the sending volume).
Healthchecks recently gained a new feature: check auto-provisioning. When you send a ping request to a slug URL, and a check with the specified slug does not exist, Healthchecks can now automatically create the missing check. This feature requires opt-in: to use it, add a ?create=1 query parameter to the ping URL.
Here’s check auto-provisioning in action (the -I parameter tells curl to send HTTP HEAD requests so that we can see HTTP response status codes easily):
The first request returns HTTP 404 (“Not Found”) because a check with a slug does-not-exist does, in fact, not yet exist.
The second request has a “?create=1” added to the URL to enable auto-provisioning. The server creates a new check and returns HTTP 201 (“Created”).
The third request is the same as the second, but a matching check now exists. The server accepts the ping and returns HTTP 200 (“OK”).
When is this useful? Whenever you are working with a dynamic infrastructure, and want your monitoring clients to be able to register with Healthchecks.io automatically. If you distribute the Ping Key to monitoring clients, each client can pick its own slug (for example, derived from the server’s hostname), construct a ping URL (https://hc-ping.com/<ping-key>/<slug-chosen-by-client>?create=1), and Healthchecks.io will auto-create a new check on the first ping.
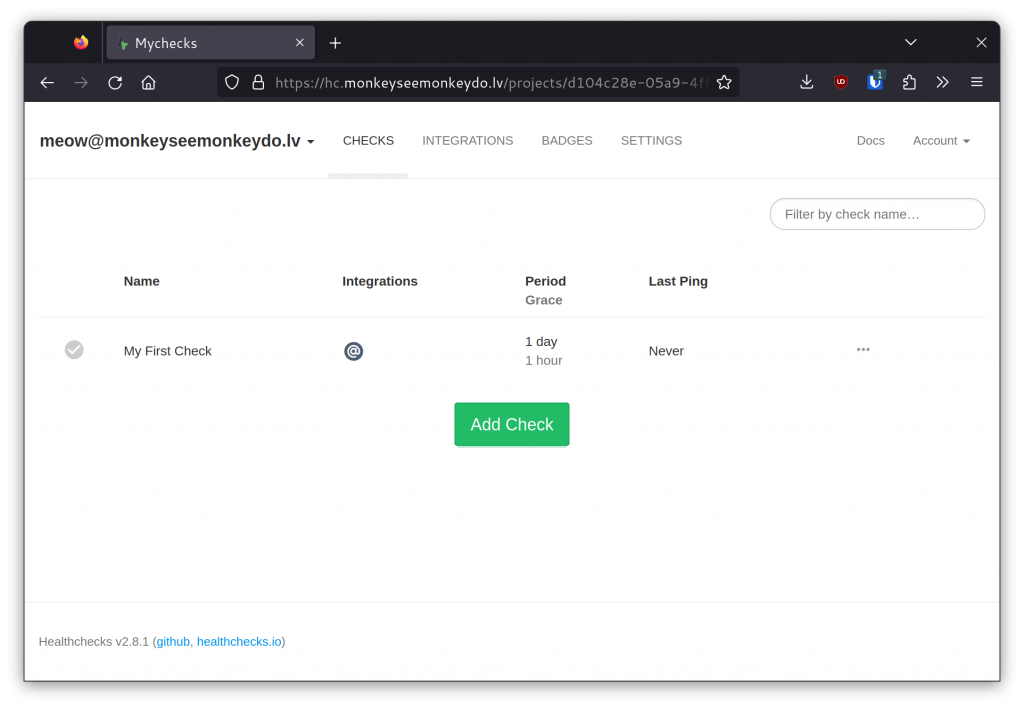
Auto-Provisioned Checks Use Default Configuration
With the current auto-provisioning implementation, clients can create new checks on the fly, but they cannot yet specify the period, the grace time, the enabled integrations, or any other parameters. The new checks will be created with default parameters (period = 1 day, grace time = 1 hour, all integrations enabled). If you need to change any parameters, you will need to do this either manually from the web dashboard, or from a script that calls Management API.
Auto-Provisioning and Account Limits
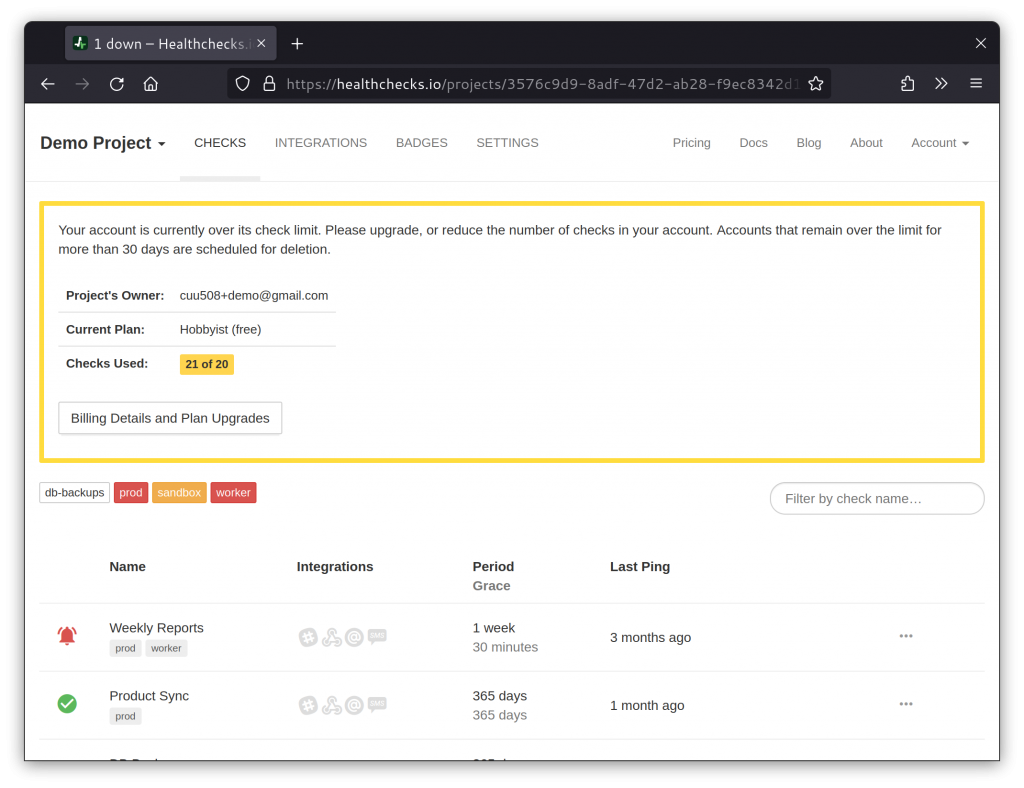
Each account has a specific limit of how many checks it is allowed to create: 20 checks for free accounts; 100 or 1000 checks for paid accounts. To reduce friction and the risk of silent failures, the auto-provisioning functionality is allowed to temporarily exceed the account’s check limit up to two times. Meaning, if your account is already maxed out, auto-provisioning will still be able to create new checks until you hit two times the limit. If your account goes over the limit, you will start to see warnings in the dashboard and email:
As soon as you get the number of checks in your account below the limit (either by upgrading to higher limits, or by removing unneeded checks), the warning will go away. If you do not resolve the warning for more than a month, you will start seeing an “Account marked for deletion” notice in the dashboard. After another month of inaction, the account will be deleted.
Slugs and Names Are Now Separate
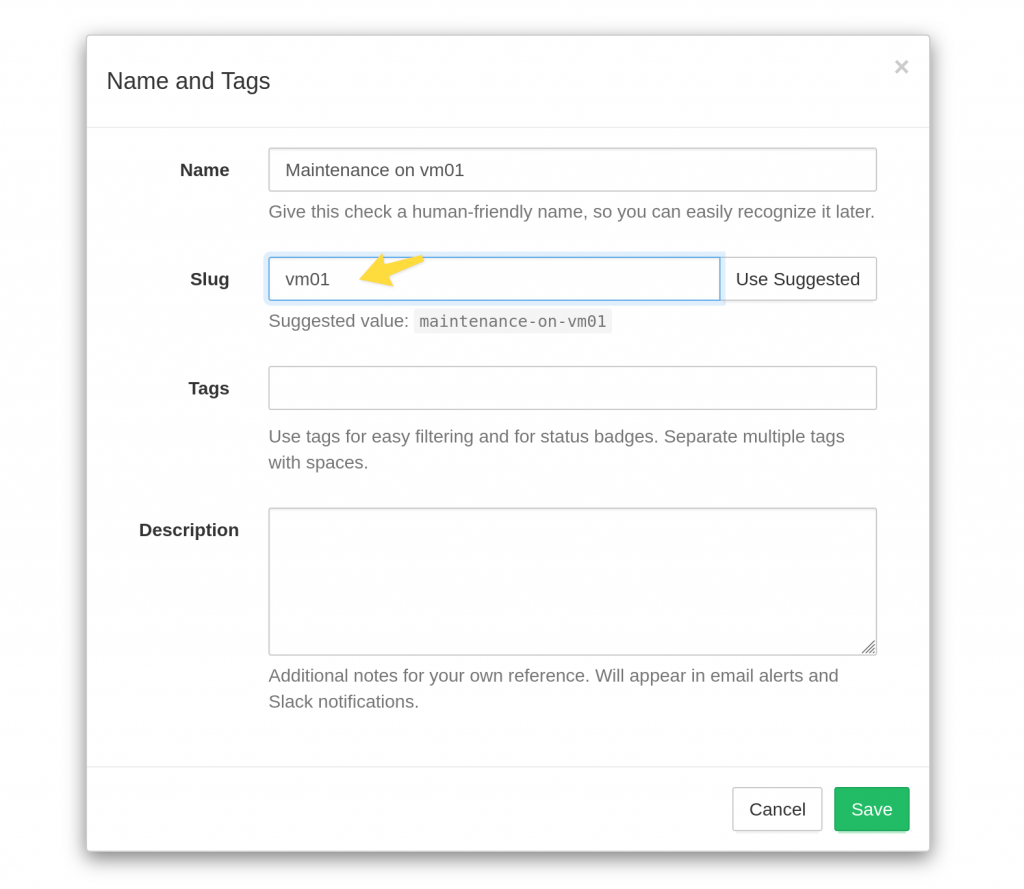
In the initial slug implementation check slugs were tied to check names. Changing a check’s name also updated its slug. With the introduction of auto-provisioning, check names and slugs are now decoupled. You can hand-pick a custom slug for each check. You can also rename a check but keep its existing slug.
The “Name and Tags” dialog has gained a new, editable “Slug” field:
Use LetsEncrypt certificates initially, and load-balancer-managed certificates later for a HA setup.
Use an external SMTP relay for sending email.
Prerequisites:
A domain name (and access to its DNS settings).
A payment card (for setting up a hosting account)
Working SMTP credentials for sending emails.
Hosting Setup
For this exercise, I’m using UpCloud as the hosting provider. I’m choosing UpCloud because they are a European cloud hosting provider that I have not used before, and they offer managed databases.
I registered for an account, deposited €10, and launched the cheapest server they offer (1 core, 1GB RAM, €7/mo) with Ubuntu 22.04 as the OS. On the new server, I:
I then ran docker compose up. The Healthchecks container started up, but I could not access it from the browser yet: it does not expose any ports, it has no domain name, and there is no TLS terminating proxy yet.
Add DNS records, Add caddy, Add ALLOWED_HOSTS, SITE_ROOT
I own a domain name “monkeyseemonkeydo.lv”, and for this Healthchecks instance I used the subdomain “hc.monkeyseemonkeydo.lv”. I created two new DNS records:
hc.monkeyseemonkeydo.lv A 94.237.80.66
hc.monkeyseemonkeydo.lv AAAA 2a04:3542:1000:910:80a5:5cff:fe7f:0a17
(These are of course the IPv4 and IPv6 addresses of the UpCloud server).
In docker-compose.yml I added a new “caddy” service to act as a TLS terminating reverse proxy, and I added ALLOWED_HOSTS and SITE_ROOT environment variables in the “web” service:
Note: Caddy needs a persistent “/data” volume for storing TLS certificates, private keys, OCSP staples, and other information.
After running docker compose up again, the site loads in the browser:
Add DEBUG=False and SECRET_KEY
Next, I added DEBUG and SECRET_KEY environment variables. DEBUG=False turns off the debug mode, which should always be off on public-facing sites. SECRET_KEY is used for cryptographic signing and should be set to a unique, secret value. Do not copy the value I used!
I created a managed PostgreSQL database in the UpCloud account. I selected PostgreSQL 15.1, and the lowest available spec (1 node, 1 core, 2GB RAM, €30/mo). I made sure to select the same datacenter that the web server is in.
After the database server started up, I took note of the connection parameters: host, port, username, password, and database name. Since I was planning to use this database server for the Healthchecks instance and nothing else, I used the default database user (“upadmin”) and the default database (“defaultdb”). Here is the database configuration:
After another docker compose up, I created a superuser account:
docker compose run web /opt/healthchecks/manage.py createsuperuser
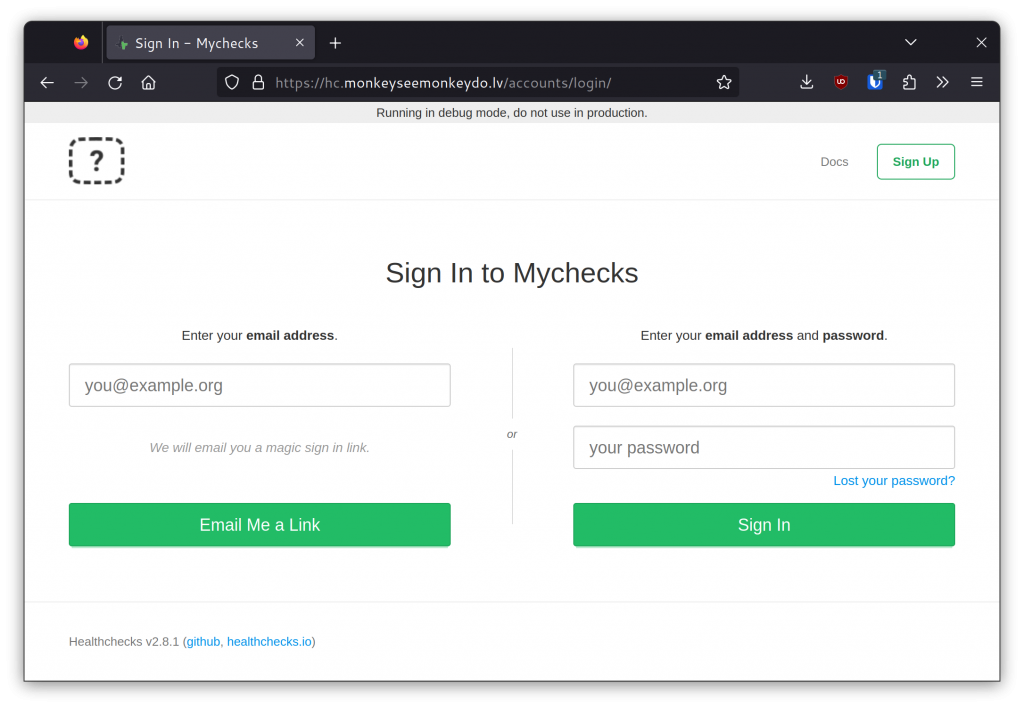
I tested the setup by signing in as the superuser:
Configure Outgoing Email
The Healthchecks instance needs valid SMTP credentials for sending email.
For a production site, I would sign up for an SMTP relay service. Since I’m setting this instance up only for demonstration purposes, and the volume of sent emails will be very low, I used my personal mail (hosted by Fastmail) SMTP credentials.
The ADMINS setting sets the email addresses that will receive error notifications. The DEFAULT_EMAIL_FROM sets the “From:” address for emails from this Healthchecks instance.
Disable New User Signups
The new Healthchecks instance currently allows any visitor to sign up for an account. This will be a private instance, so I disabled new user registration via the REGISTRATION_OPEN environment variable:
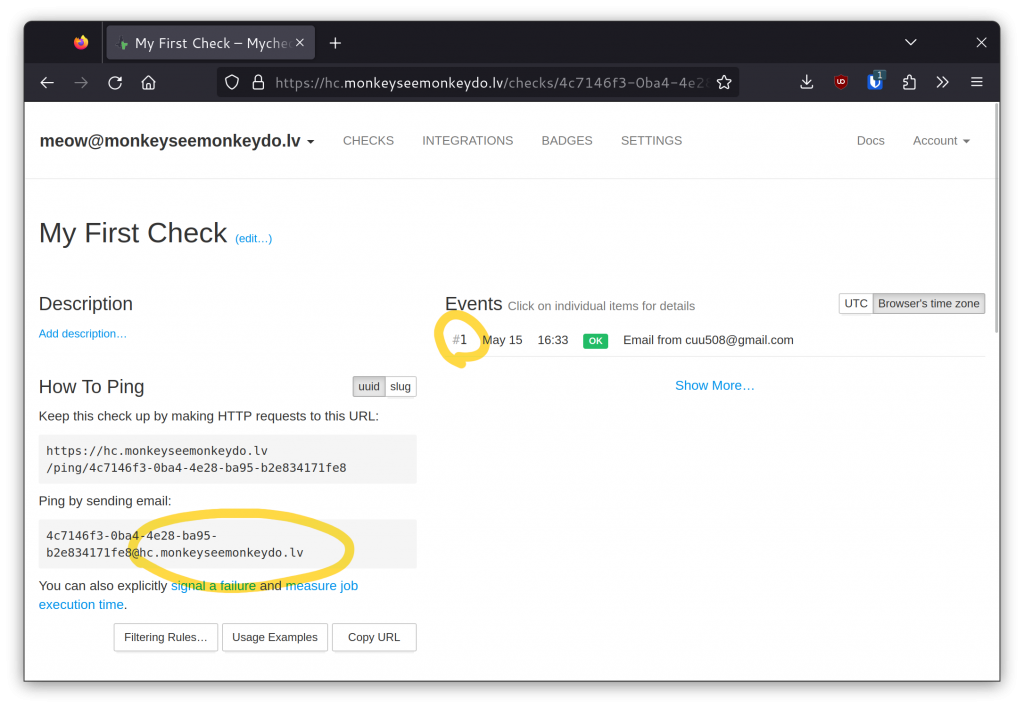
Healthchecks supports pinging (sending heartbeat messages from clients) via HTTP and also via email. To enable pinging via email, I set the PING_EMAIL_DOMAIN and SMTPD_PORT environment variables, and exposed port 25:
After another docker compose up, I sent a test email and verified its arrival:
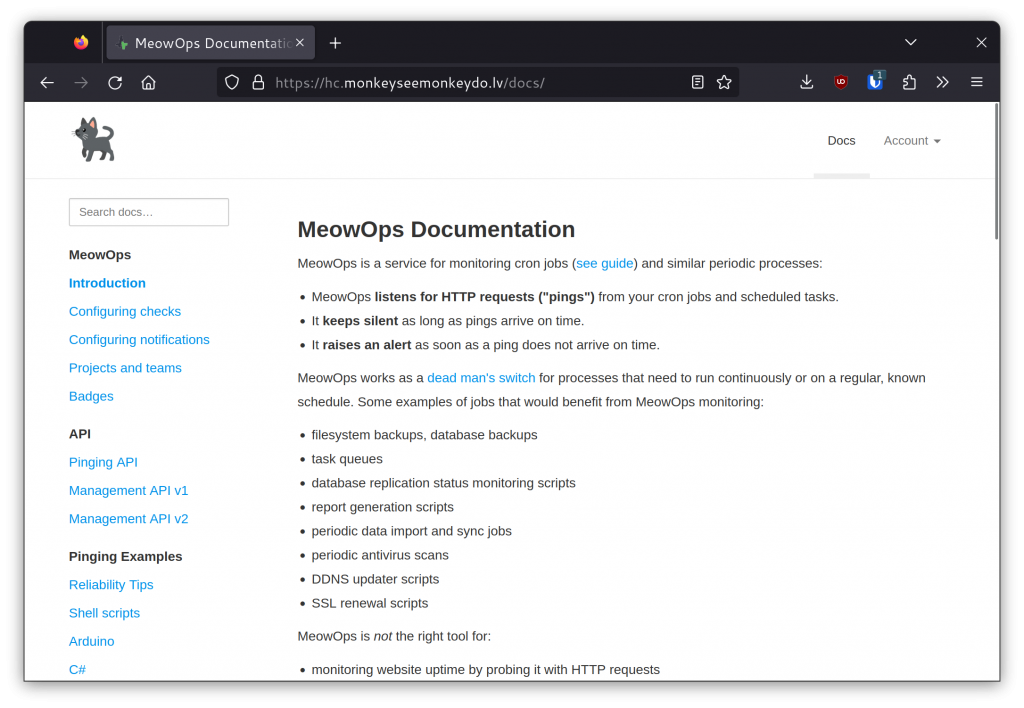
Add Logo and Site Name
The default logo image is located at /opt/healthchecks/static-collected/img/logo.png inside the “web” container. To use a custom logo, one can either set the SITE_LOGO_URL environment variable or mount a custom logo over the default one. I used the latter method.
With the current setup, the web server and the database are both single points of failure. For a production setup, it would be desirable to have as few single points of failure as possible.
The database part is easy, as UpCloud-managed databases support HA configurations. I changed the database plan from 1 node to 2 HA nodes (2 cores, 4GB RAM, €100/mo) and that was that. I did not even need to restart the web container.
The web server part is more complicated: launch a second web server, put a managed load balancer in front of both web servers, and move TLS termination to the load balancer. I updated docker-compose.yml yet again:
I removed the “caddy” service since the load balancer will now be terminating TLS.
I removed the ALLOWED_HOSTS setting. This was required to get the load balancer health checks to work (UpCloud’s load balancer does not send the Host request header).
I exposed port 8000 of the “web” service on a private IP that the load balancer will connect through.
I updated the port 25 entry to bind only to the private IP.
The following steps are UpCloud-specific, not Healthchecks-specific, so I will only summarize them:
I launched a second web server and set it up identically to the existing one.
I created a managed load balancer (2 HA nodes, €30/mo).
I replaced the “A” and “AAAA” DNS records for hc.monkeyseemonkeydo.lv with a CNAME record that points to the load balancer’s hostname.
I configured the load balancer to terminate TLS traffic on port 443, add X-Forwarded-For request headers, and proxy the HTTP requests to the web servers.
I configured the load balancer to proxy TCP connections on port 25 to port 25 on the web servers.
Costs
For the single-node setup:
Web server: €7/mo.
Database: €30/mo.
Total: €37/mo.
For the HA setup:
Web servers: 2 × €7/mo.
Database: €100/mo.
Load balancer: €30/mo.
Total: €144/mo.
Monitoring, Automation, Documentation
At this point, the Healthchecks instance is up and running and the walk-through is complete. For real-world deployment, also consider the following tasks:
Set up uptime monitoring using your preferred uptime monitoring service.
Set up CPU / RAM / disk / network monitoring using your preferred infrastructure monitoring service.
Set up monitoring for notification delivery.
Move secret values out of docker-compose.yml, and store docker-compose.yml under version control.
Document the web server setup and update procedures.
Automate the setup and update tasks if and where it makes sense.
Thanks for reading, and good luck in your self-hosting adventures, –Pēteris
