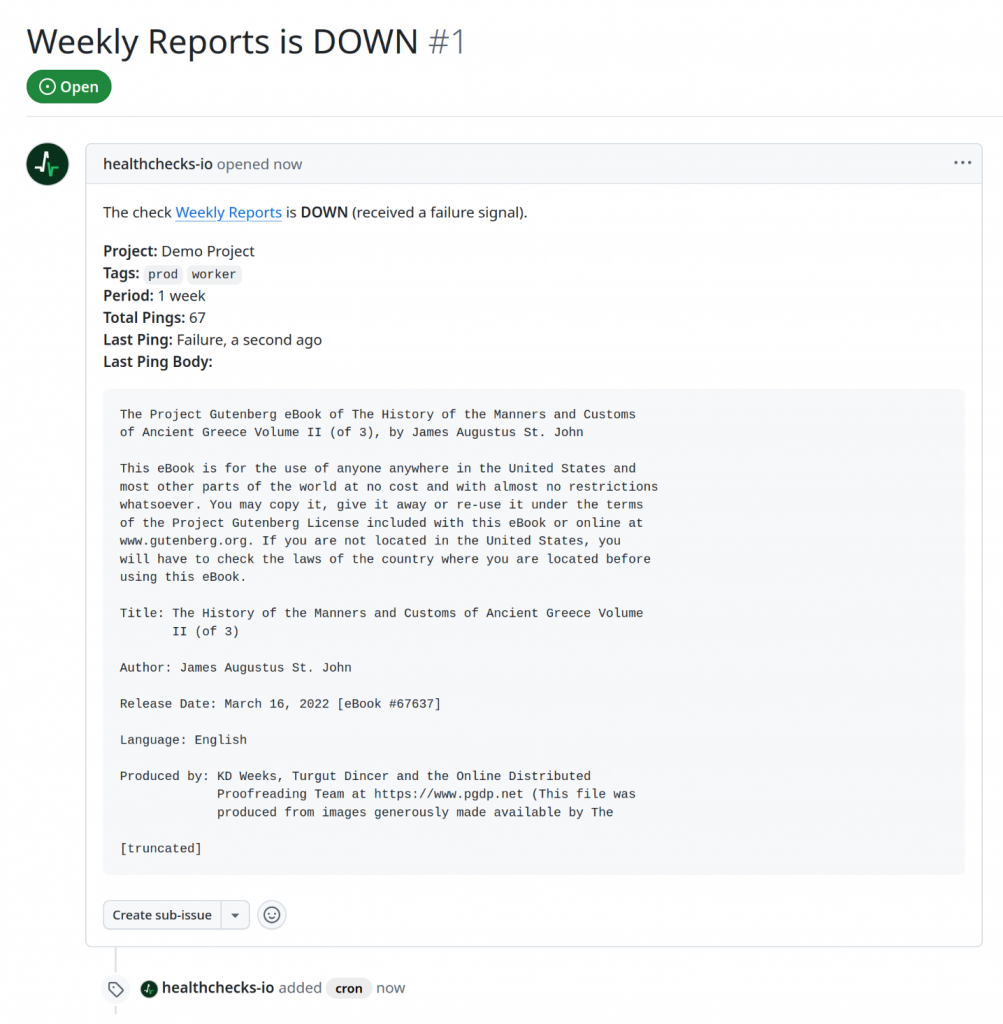
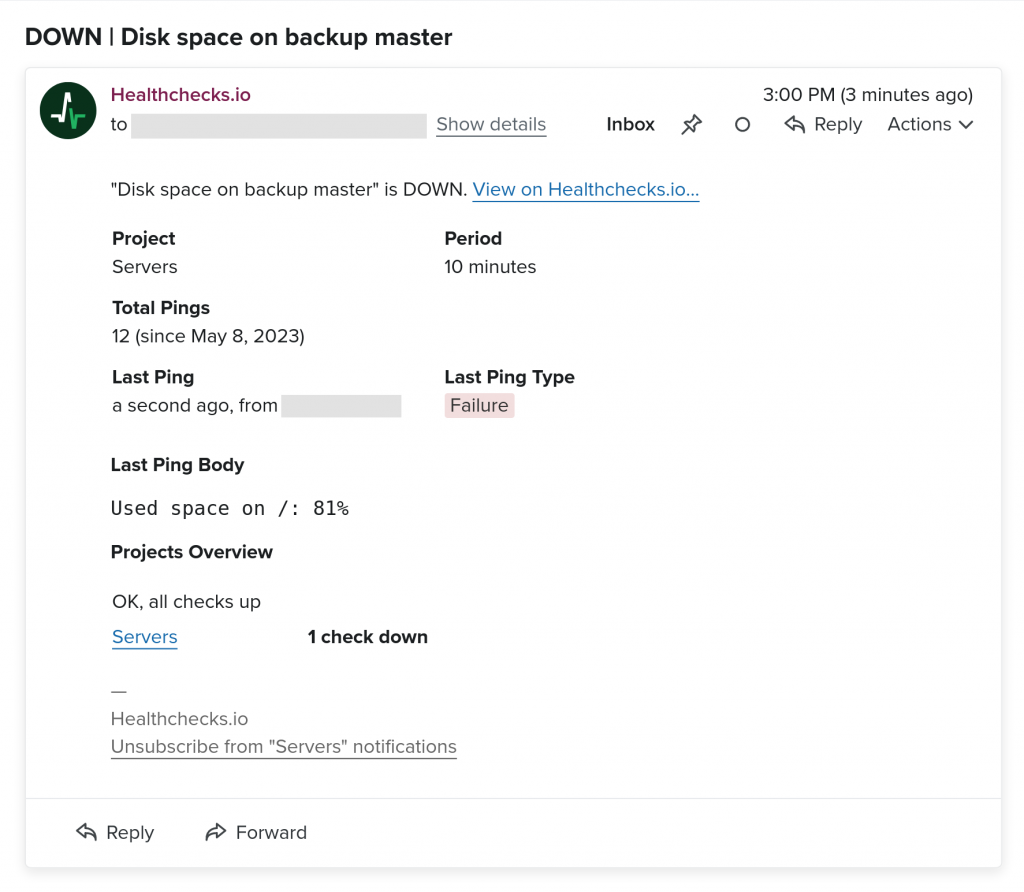
Healthchecks can now notify you about a failing check by opening a new issue in your chosen GitHub repository. Here is an example of how the GitHub issue might look:
The technical side of creating a new issue is straightforward: GitHub has an API call for creating an issue. You make an HTTP POST request with an access token in a request header and the issue title, body, and labels in the request body.
However, where do we get the access token from? The API call accepts three types of access tokens:
- GitHub App user access tokens
- GitHub App installation access tokens
- Fine-grained personal access tokens
From the implementation perspective, personal access tokens would be the easiest to support. When the user sets up a GitHub integration, Healthchecks would guide the user through creating a personal access token with appropriate permissions, and ask the user to paste the personal access token in a form. But personal access tokens (PATs) have several drawbacks:
- GitHub docs recommend PATs for short-lived scripts, bespoke developer-y things. GitHub docs recommend against using them in production apps.
- PATs expire and need to be regenerated regularly.
- PATs work on behalf of the user. The issues will appear as created by the user (not created by Healthchecks).
- The end-user experience is not ideal. Regular users should not need to follow multi-step instructions to go into GitHub’s Settings > Developer Settings, pick permissions, and copy/paste cryptic strings around.
So I looked into GitHub Apps. Here, the developer first registers a GitHub app, with a logo, description, client ID, client secret, and other configuration settings. The developer can specify precisely what permissions the app will need: in our case, we need read-write access to repository issues and nothing else. When the user sets up a GitHub integration, they must install the GitHub App in their personal or their organization’s account. During app installation, the user can either grant the app access to all repositories or to specific repositories. There are two types of access tokens associated with GitHub Apps:
- Installation access tokens. These tokens have a
ghs_prefix. If Healthchecks uses an installation access token, the issue will appear as created by Healthchecks (a bot user). - User access tokens. These tokens have a
ghu_prefix. These tokens let us perform actions on the user’s behalf, the issue will appear as created by the user.
Clearly, the installation access tokens seem like the right tool for the job. One lingering problem is that when a user is setting up a GitHub integration for a specific repository, how do we know if they have access to this repository? Consider the following scenario:
- Alice sets up a GitHub integration for the repository
alice/foobar. As instructed, Alice installs the Healthchecks GitHub app in their personal GitHub account. - Eve also sets up a GitHub integration for the repository
alice/foobar. Eve does not have access to this repository. But, since the Healthchecks GitHub app is already installed in Alice’s account, Healthchecks does have access to this repository. Eve can now create issues in Alice’s repository.
Perhaps I did not look hard enough, but I did not find clear guidance about this potential security gotcha in GitHub documentation. I did find one StackOverflow question asking about the same issue. The solution I devised uses user access tokens during integration setup, and installation access tokens when creating issues. The integration setup flow is as follows:
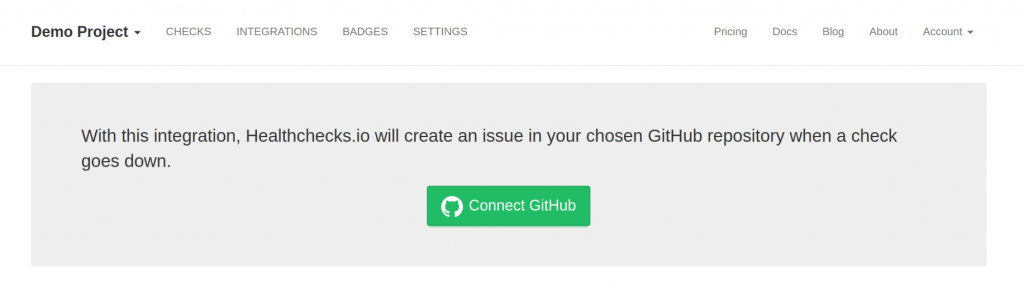
In Healthchecks, the user clicks on a “Connect GitHub” button:
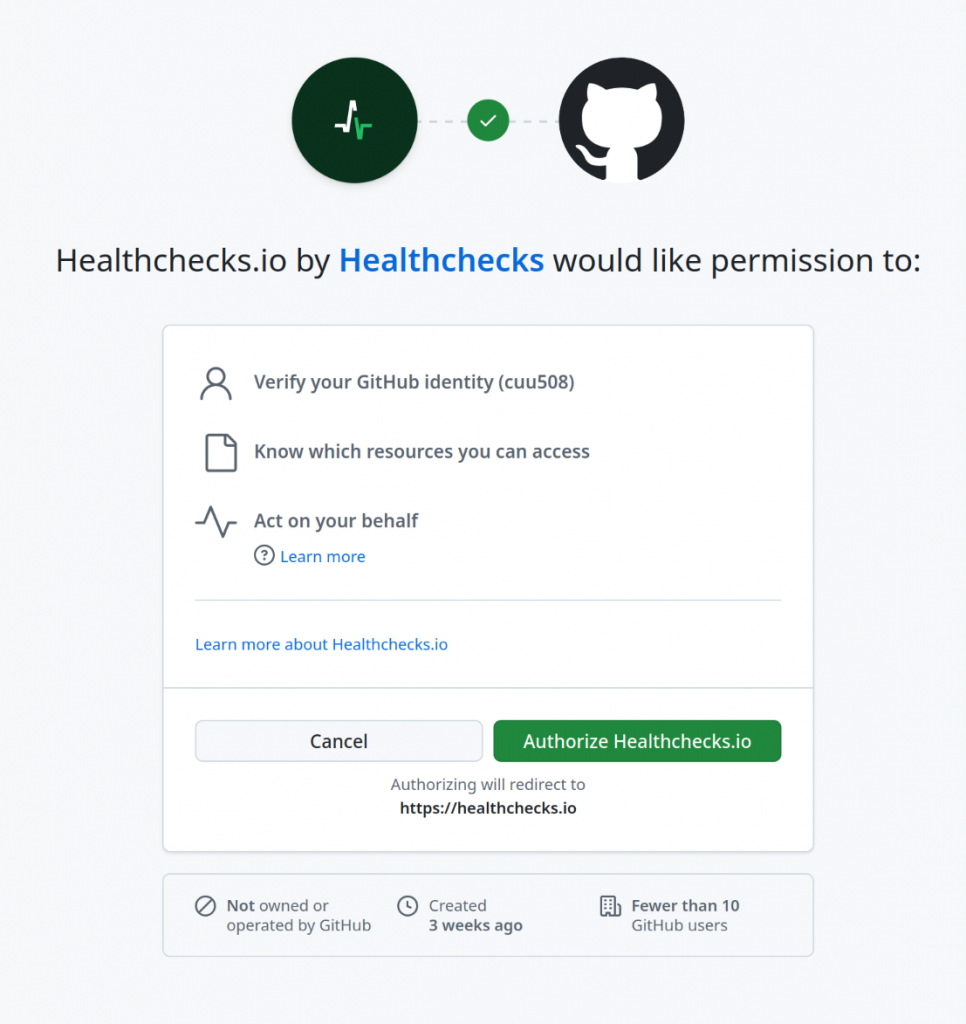
They are redirected to GitHub and asked to authorize the Healthchecks GitHub app.
If the user follows through, Healthchecks acquires the user access token. Using the user access token, Healthchecks makes an API call to fetch the list of available repositories. If the list of repositories is empty, Healthchecks redirects the user to the GitHub App’s installation page:
Healthchecks asks the user to select a repository. When the user clicks “Save Integration”, Healthchecks checks if the selected repository was in the list of repositories retrieved from API. Therefore, Eve cannot smuggle Alice’s repository in:
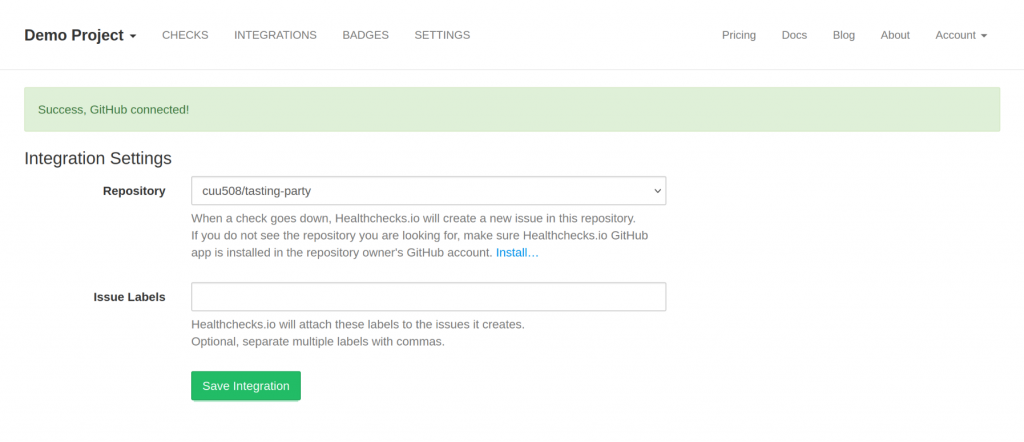
After the integration is saved, Healthchecks forgets the user access token, and creates an installation access token each time it needs to create an issue.
Documentation pointers:
- Generating a user access token
- GitHub API call for listing app installations accessible to user access token
- GitHub API call for listing an installation’s repositories
- Generating an installation access token
- GitHub API call for creating a new issue
The GitHub integration is live and ready for use on Healthchecks.io. But I am left with a thought: given how developers are often happy to jump on the first nominally working solution they can find, how many GitHub apps are out there where one user can impersonate another user (like Eve and Alice in the hypothetic scenario above)?
In any case, stay safe, and–happy monitoring!
–Pēteris
