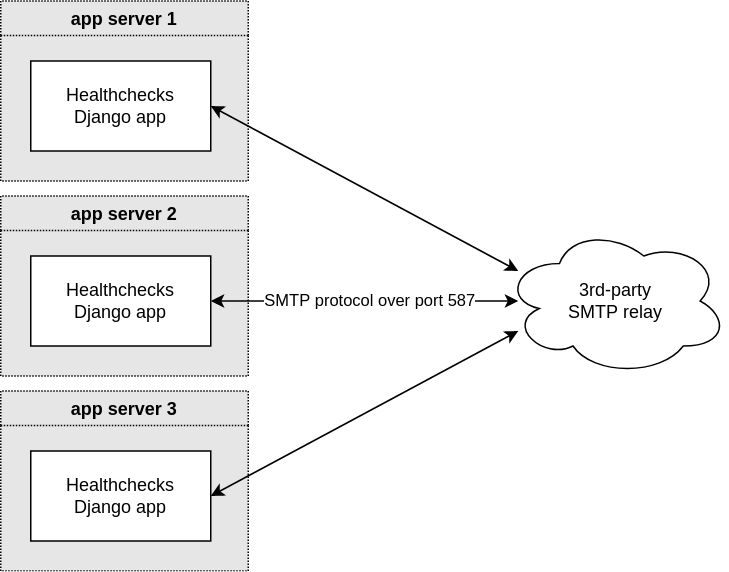
I recently made a change to how Healthchecks sends transactional email. Before:
The Healthchecks Django app is directly connecting to a 3rd-party SMTP relay (think AWS SES, SendGrid, Mailgun, but in our specific case it is Elastic Email), and sends SMTP commands over a TLS-encrypted connection. If the send operation fails, the Django app retries a couple times, then gives up and the email is lost.
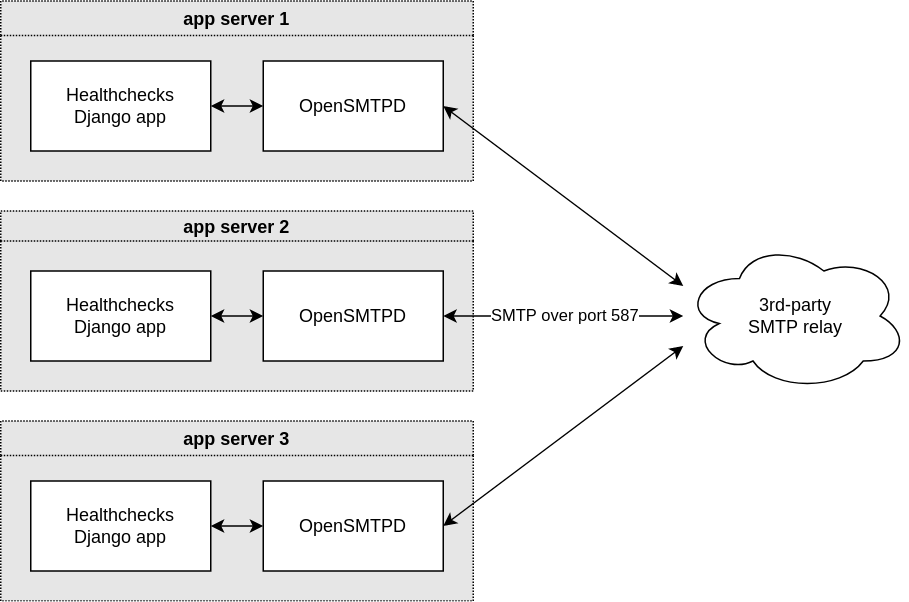
After:
A local OpenSMTPD instance runs on the same machine as the Django app. It accepts connections from local clients only, and relays all received messages to the external SMTP relay operated by, in our case, Elastic Email.
In this setup, the Django app can quickly hand off the outgoing emails to OpenSMTPD, and OpenSMTPD retries failed sends for minutes, hours or even days. If the 3rd-party SMTP relay has an outage, emails are not lost, just delayed. At least that’s the theory – we shall see how well this works in practice.
The OpenSMTPD configuration for this use case is surprisingly compact:
table secrets file:/etc/mail/secrets
listen on lo inet4 port 25
action "relay" relay host smtp+tls://smtp@external.smtp.host:587 auth <secrets>
match for any action "relay"
I also experimented with Postfix (as recommended here), and it gets the job done too. I also considered more lightweight relay-only MTAs: dma and nullmailer. Neither supports listening on port 25, instead you enqueue emails by piping data to /usr/sbin/sendmail. This complicates integration with the Django app somewhat. I ultimately went with OpenSMTPD because it seemed to have the right balance of features and simplicity.
All servers are located in the Falkenstein data center park, scattered across the FSN-DCx data centers so they are not all behind the same core switch. The monthly Hetzner bill is €484.
Software
Ubuntu 20.04 on all machines.
Systemd manages services that need to run continuously (haproxy, nginx, postgresql, etc.)
Wireguard for private networking between the servers. Tiered topology: HAProxy servers cannot talk to PostgreSQL servers.
Netdata agent for monitoring the machines and the services running on them. Connected to Netdata Cloud for easy overview of all servers.
HAProxy 2.2 for terminating TLS connections, and load balancing between app servers. Enables easy rolling updates of application servers.
PostgreSQL 13, streaming replication from primary to standby. No automatic failover: I can trigger failover with a single command, but the decision is manual.
On app servers:
uWSGI runs the Healthchecks Python application (web frontend, management API).
hchk, a small application written in Go, handles ping API (hc-ping.com) and inbound email.
NGINX handles rate limiting, static file serving, and reverse proxying to uWSGI and hchk.
SaaS Tools
AWS S3 for storing encrypted database backups.
Braintree for accepting payments and managing subscriptions.
Let’s say you are writing a shell script for a systems housekeeping task. Perhaps the script is uploading backups to a remote server, or it is cleaning up old data, or it is making a measurement and submitting it to a somebody else’s HTTP API. What is the least cumbersome way for the script to contact you in case of problems? Let’s say you want to be contacted via email – how to make it work?
Cron and MAILTO
If you run the script from cron, you can look into using cron’s MAILTO= option. You put a MAILTO=you@example.org line in your crontab, and, when a job fails, cron will send a notification to the specified address using system’s MTA. OK, then, what MTA to use?
sSMTP
sSMTP is a send-only MTA which hands off messages to an external SMTP server that you configure in /etc/ssmtp/ssmtp.conf. For example, you can create a dedicated Gmail address for sending notifications, and use it in ssmtp.conf like so:
Gmail-specific note: for the Gmail SMTP service to accept your credentials, you will need to set up and use an app password. To use app passwords in your Google account, you will also need to set up 2-step-verification. The app password must be guarded with the same care as your account’s main password, so putting it in ssmtp.conf is not ideal. This is why I would strongly recommend to use a separate Gmail account, not your main account, for this.
With sSMTP installed and configured, sSMTP will pass messages on to Gmail, and Gmail will deliver them to your inbox. This will make cron’s MAILTO option just work, and you can then also send messages from shell scripts using the mailx program:
I used Gmail as example, but if you use a different email provider, it likely provides an SMTP interface as well. Transactional email services also typically provide an SMTP interface. For example, I’ve used sSMTP with Mailgun, and it works great. In short, sSMTP needs working SMTP credentials – it does not matter if they are from Fastmail, Zoho, AWS SES, Sendgrid, Mailjet or something else.
HTTP API
The transacional email services usually provide a HTTP API. Depending on the provider, the API can be so simple you can use it with a simple curl call. Here’s an example with the already mentioned Mailgun:
The upside of this approach is you don’t need to install and configure anything on your server beforehand (assuming curl is preinstalled). One downside is you cannot use this method with cron’s MAILTO, as curl is not a MTA. But you can use this method just fine from scripts.
HTTP API is also easy to use from a Python script:
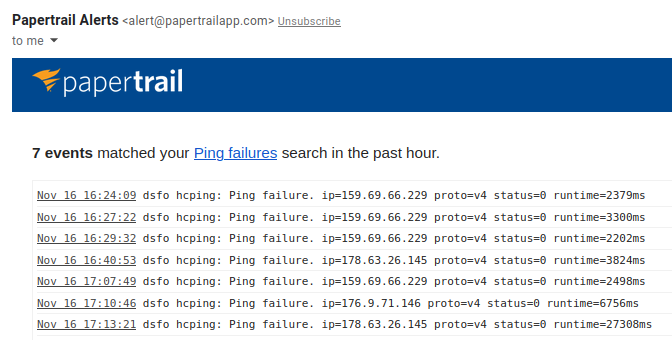
Here, I’m thinking of systems like LogDNA and Papertrail. You configure your system’s syslog to ship system logs to your chosen log management system. In that system, you set up alerting rules like “alert me if this specific keyword appears in logs this many times in this long time window”. And that is all!
Logging to syslog from scripts is easy using the logger command:
logger Hello World!
As an example, here’s a notification I received from Papertrail a few days ago. It runs a saved search once per hour and sends a notification if the search produces any results:
Cron Monitoring Services
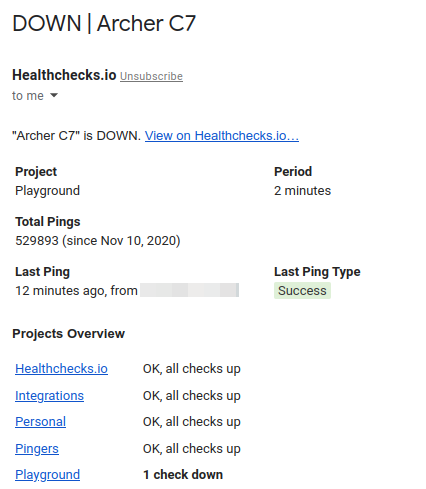
And here I am of course thinking of Healthchecks.io, but there are good alternatives too. The monitoring service provides an unique URL that the housekeeping script must request regularly. When an HTTP request from the script does not arrive on time, Healthchecks.io detects that and alerts you. This takes care of scenarios, where, for example, the server has been shut down, and so is unable to contact you by itself. Healthchecks.io offers a lot more features, but this is the basic idea.
Here’s an example notification I received from Healthchecks.io. My home router is pinging Healthchecks.io. When home connection goes down, I get an alert:
In summary:
sSMTP is a good choice for use in combination with cron’s MAILTO option
HTTP APIs are handy for sending emails from scripts, without needing to install or configure any additional software
Log management systems and cron job monitoring systems can send email notifications, but they specialize in specific tasks. Log management systems can notify you about patterns in log files, cron job monitoring systems can detect irregularities in the heartbeat signals sent by your background tasks.
When the Daylight saving time starts, and the computer’s clock jumps forward, what does cron do? If the clock jumps from 1AM to 2AM, and there is a job scheduled for 1:30AM, will cron run this job? If yes, when? Likewise, when the Daylight saving time ends, and the clock jumps backward, will cron possibly run the same scheduled job twice?
Let’s look at what “man cron” says. On my Debian-based system, under the “Notes” section:
Special considerations exist when the clock is changed by less than 3 hours, for example at the beginning and end of daylight savings time. If the time has moved forwards, those jobs which would have run in the time that was skipped will be run soon after the change. Conversely, if the time has moved backwards by less than 3 hours, those jobs that fall into the repeated time will not be re-run.
Only jobs that run at a particular time (not specified as @hourly, nor with ‘*’ in the hour or minute specifier) are affected. Jobs which are specified with wildcards are run based on the new time immediately.
Clock changes of more than 3 hours are considered to be corrections to the clock, and the new time is used immediately.
After a fair bit of experimenting, I can say the above is mostly accurate. But it takes some explaining, at least it did for me. Debian cron distinguishes between “fixed-time jobs” and “wildcard jobs”, and handles them differently when the clock jumps forward or backward.
Wildcard jobs. Here’s a specific example: */10 * * * *, or, in human words, “every 10 minutes”. Debian cron will try to maintain even 10-minute intervals between each execution.
Fixed-time jobs. Now consider 30 1 * * *, or “run at 1:30AM every day”. Here, the special DST handling logic will kick in. If the clock jumps an hour forward from 1AM to 2AM, Debian cron will execute the job at 2AM. And, if the clock jumps from 2AM to 1AM, Debian cron will not run the job again at the second 1:30AM.
What are the precise rules for distinguishing between wildcard jobs and fixed-time jobs? Let’s look at the source code!
Source
Debian cron is based on Vixie cron, but it adds Debian-specific feature and bugfix patches on top. The special DST handling logic is one such patch. I found Debian cron source code at salsa.debian.org/debian/cron/. Here is the DST patch: Better-timeskip-handling.patch.
Unless you are already familiar with cron source, to understand the patch, you would want to see it in context. We can apply Debian patches in the correct order using the quilt tool:
$ git clone https://salsa.debian.org/debian/cron.git
$ cd cron
$ QUILT_PATCHES=debian/patches quilt push -a
Now we can read through entry.c and cron.c and learn how they work. My C skills are somewhere at the FizzBuzz level so this is a little tricky. Anyway, it looks like cron parses the expression one character at a time. At every step, it knows how far into the expression it is, whether it is parsing a number, a range, a symbolic month reference, and so on. If the first character of the minute or the hour specifier is the wildcard, it sets the MIN_STAR or HR_STAR flags. It later uses these flags to decide whether to use the special DST handling logic.
Here’s what this means for specific examples:
* 1 * * * (every minute from 1:00 to 1:59) is a wildcard expression because the minute specifier is “*”.
15 * * * * (at 15 minutes past every hour) is a wildcard expression because the hour specifier is “*”.
15 */2 * * * (at 0:15, 2:15, 4:15, …) is also a wildcard expression because the hour specifier starts with “*”.
0-59 1 * * * (every minute from 1:00 to 1:59) is not a wildcard expression because neither the minute specifier nor the hour specifier starts with “*”.
Quite interesting! But I am not a C compiler (gasp!), and my interpretation may very well be wrong. Let’s test this experimentally, by actually running Debian cron. And, since we are impatient, let’s speed up time using QEMU magic.
QEMU Magic
I followed these instructions to install Debian in QEMU. I then launched QEMU with the following parameters:
The -icount (instruction counter) parameter is the main hero here. By setting align=off,sleep=off we allow the emulated system’s clock to run faster than real-time – as fast as the host CPU can manage. We can also tweak the shift parameter for even faster time travel (read QEMU man page for more on this).
Inside the emulated system, I set the system timezone to “Europe/Dublin”, and added my test entries in root’s crontab. I tested many different expressions, but let’s look at the following two – the first one is a wildcard job, and the second one is a fixed-time job right in the middle of the DST transition window for Europe/Dublin:
For the “Europe/Dublin” timezone, the year 2021, the daylight saving time started on March 28, 1AM. The clock moved 1 hour forward. Let’s see how Debian cron handles it:
$ journalctl --since "2021-03-27" -t experiment1
[...]
Mar 27 23:30:01 debian experiment1[1016]: 2021-03-27T23:30:01+00:00
Mar 28 00:30:01 debian experiment1[3456]: 2021-03-28T00:30:01+00:00
Mar 28 02:30:01 debian experiment1[3866]: 2021-03-28T02:30:01+01:00
Mar 28 03:30:01 debian experiment1[3887]: 2021-03-28T03:30:01+01:00
[...]
We can see the wildcard job ran 30 minutes past every hour, but the entry for 1:30 is missing. This is because this time “doesn’t exist”, the local time skipped from 00:59 directly to 02:00. Now let’s look at the fixed-time job:
$ journalctl --since "2021-03-27" -t experiment2
Mar 27 01:30:01 debian experiment2[366]: 2021-03-27T01:30:01+00:00
Mar 28 02:00:01 debian experiment2[3849]: 2021-03-28T02:00:01+01:00
Mar 29 01:30:01 debian experiment2[4551]: 2021-03-29T01:30:01+01:00
[...]
On March 28, the job was scheduled to run at 01:30, but instead, it was run at 02:00. This is Debian cron’s special DST handling in action: “If the time has moved forwards, those jobs which would have run in the time that was skipped will be run soon after the change.“
Now let’s look at October 2021. For the “Europe/Dublin” timezone, the daylight saving time ends on October 31, 2AM. The clock is moved 1 hour back.
$ journalctl --since "2021-10-30" -t experiment1
[...]
Oct 31 00:30:01 debian experiment1[1166]: 2021-10-31T00:30:01+01:00
Oct 31 01:30:01 debian experiment1[1191]: 2021-10-31T01:30:01+01:00
Oct 31 01:30:01 debian experiment1[1212]: 2021-10-31T01:30:01+00:00
Oct 31 02:30:01 debian experiment1[1233]: 2021-10-31T02:30:01+00:00
[...]
In this one, it appears as if the wildcard job ran twice at 1:30. But, if you look closely at the ISO8601 timestamp, you can see the timezone offsets are different. The first run was before the DST transition, then the clock moved 1 hour back, and the second run happened an hour later. Debian cron maintains a regular cadence for wildcard jobs (60 minutes for this job). Now, the fixed-time job:
$ journalctl --since "2021-10-30" -t experiment2
Oct 30 01:30:01 debian experiment2[444]: 2021-10-30T01:30:01+01:00
Oct 31 01:30:01 debian experiment2[1192]: 2021-10-31T01:30:01+01:00
Nov 01 01:30:01 debian experiment2[1950]: 2021-11-01T01:30:01+00:00
[...]
The fixed-time job was executed once at 01:30 but was not run again an hour later. This is again thanks to the special DST handling: “if the time has moved backwards by less than 3 hours, those jobs that fall into the repeated time will not be re-run“.
Let’s also check if Debian cron treats 0-59 1 * * * as a wildcard or a fixed-time job.
$ crontab -l
0-59 1 * * * logger -t experiment3 `date -Iseconds`

$ journalctl --since "2021-03-27" -t experiment3
[...]
Mar 27 01:57:01 debian experiment3[598]: 2021-03-27T01:57:01+00:00
Mar 27 01:58:01 debian experiment3[602]: 2021-03-27T01:58:01+00:00
Mar 27 01:59:01 debian experiment3[606]: 2021-03-27T01:59:01+00:00
Mar 28 02:00:01 debian experiment3[1218]: 2021-03-28T02:00:01+01:00
Mar 28 02:00:01 debian experiment3[1222]: 2021-03-28T02:00:01+01:00
Mar 28 02:00:01 debian experiment3[1226]: 2021-03-28T02:00:01+01:00
[...]
On March 27, the job ran at minute intervals, but on March 28 the runs are all bunched up at 02:00. In other words, Debian cron treated this as a fixed-time job and applied the special handling.
I’ve found the QEMU setup to be a handy tool for checking assumptions and hypotheses about cron’s behavior. Thanks to the accelerated clock, experiments take minutes or hours, not days or weeks.
Who Cares, and Closing Notes
Who cares about all this? Well – I do! Healthchecks.io is a cron job monitoring service, its cron handling logic needs to be as robust and correct as possible.
Like many other Python projects, Healthchecks used croniter for handling cron expressions. It did not seem viable to fix DST handling bugs in croniter, so I started a separate library, cronsim. It is smaller, quicker, and tested against Debian cron with 5000+ different cron expressions.
Ah, but why target Debian cron and not some other cron implementation? To be honest, primarily because I happen to use Ubuntu (a Debian derivative) on all my systems. I also suspect Debian and its derivatives together have a large if not the largest server OS market share, so it is a reasonable target.
One final note: there is a simple alternative to dealing with the DST complexity. Use UTC on your servers!
Healthchecks.io pinging API has always been based on UUIDs. Each Check in the system has its own unique and immutable UUID. To send a success signal (“ping”), clients make a request to https://hc-ping.com/ with check’s UUID added at the end:
This is conceptually simple and has worked quite well. It requires no additional authentication. The UUID value is the authentication, and the UUID “address space” is so vast nobody is going to find valid ping URLs by random guessing any time soon.
Still, UUID-based ping URLs have downsides too.
UUIDs are not particularly human-friendly. Unless you are good at memorizing UUIDs, it is not easy to associate a ping URL with a check just by looking at it. But it is easy to make mistakes when copy/pasting UUIDs around.
Each UUID is a secret. Therefore, if you have many things to monitor, you must keep many secrets. Let’s consider a specific example: a web application that does various housekeeping tasks on a schedule. Each housekeeping task has a corresponding Check in Healthchecks.io and a ping URL. The web app stores its configuration, including ping URLs, in environment variables: FOO_TASK_URL, BAR_TASK_URL, and so on. This is all well and good. But, as the web app grows and adds new types of housekeeping tasks, the number of environment variables can get out of hand. In one specific project I’m working on, there are already 15 environment variables for storing ping URLs, and there will likely be more. Wouldn’t it be nice if there was a way to store just a single secret, and derive all ping URLs from it?
Introducing: Slug URLs
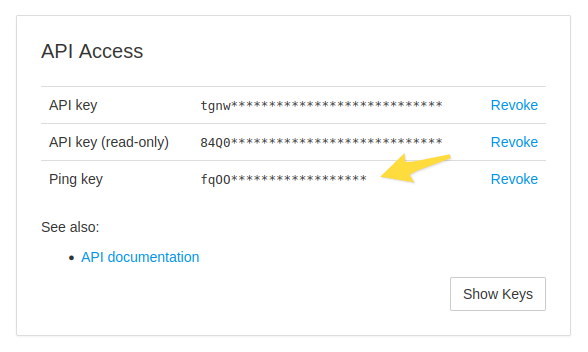
In slug URLs, we replace the UUID with two components, a ping key and a slug:
All checks in a single project share the same ping key. You can look up or generate the ping key in your project’s Settings screen, right next to your project’s API keys:
Healthchecks.io derives slug from Check’s name using Django’s slugify function. The slugify function applies the following transformations:
Converts to ASCII.
Converts to lowercase.
Removes characters that aren’t alphanumerics, underscores, hyphens, or whitespace.
Replaces any whitespace or repeated hyphens with single hyphens.
Removes leading and trailing whitespace, hyphens, and underscores.
Here are a few specific examples of check names and the resulting slugs:
Name
Slug
DB Backup
db-backup
Backup /opt/some/path
backup-optsomepath
server1 -> server2
server1-server2
Going back to the web app with housekeeping tasks example, with slug URLs the web app would need to store just one secret – the pinging key, and would be able to construct all ping URLs off that. Here is a rough example in Python:
// foo_task.py
import os
import requests

// ... do some work here ...

requests.get("https://hc-ping.com/%s/foo_task" % os.getenv("PING_KEY"))
The ping URLs are also more human-friendly. The slug part helps you tell them apart.
Q&A
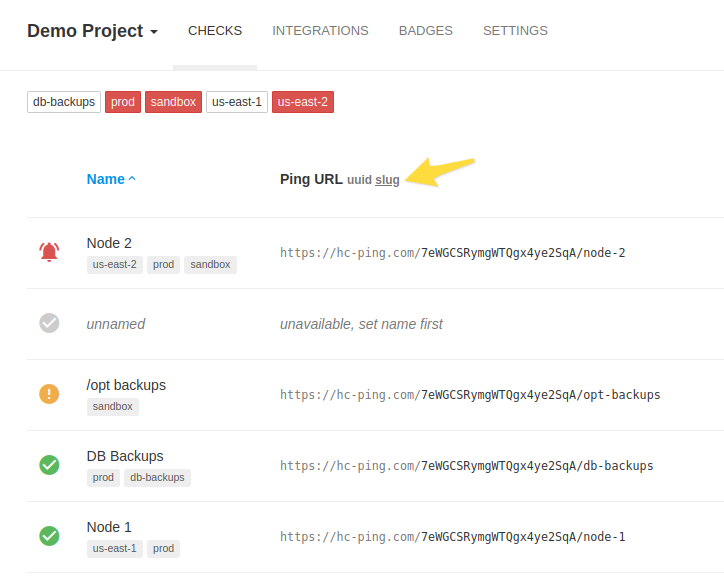
Q: How can I use slug URLs in my Healthchecks.io project? A: First, generate the ping key in your project’s Settings page. Next, click on “slug” on the Checks page:
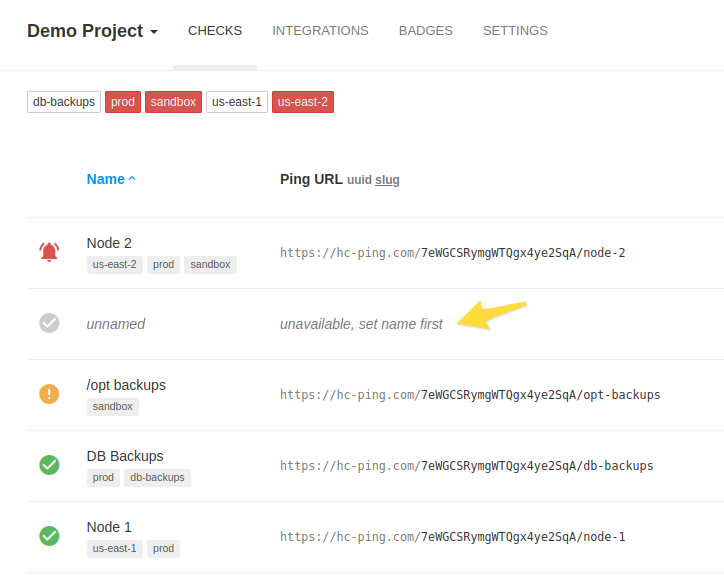
Q: What if a check has no name? A: The check will have no corresponding slug URL then:
Q: What if multiple checks in the project have the same name? A: They will also have the same slug. When you try to ping them, you will get an HTTP 409 response with the text “ambiguous slug” in the response body.
Q: Can I use UUID and slug URLs at the same time? A: Yes, you can use UUID URLs and slug URLs interchangeably.
Q: Then what does the uuid / slug selector do, exactly? A: It selects which URL format is used for display in the list and details views on Healthchecks.io.
Current Status
Slug URLs are implemented and ready for use on Healthchecks.io. This is a brand new feature and it will likely receive refinements over time. If you notice problems when using slug URLs, or want to suggest improvements, please send your feedback to contact@healthchecks.io. I will appreciate it!
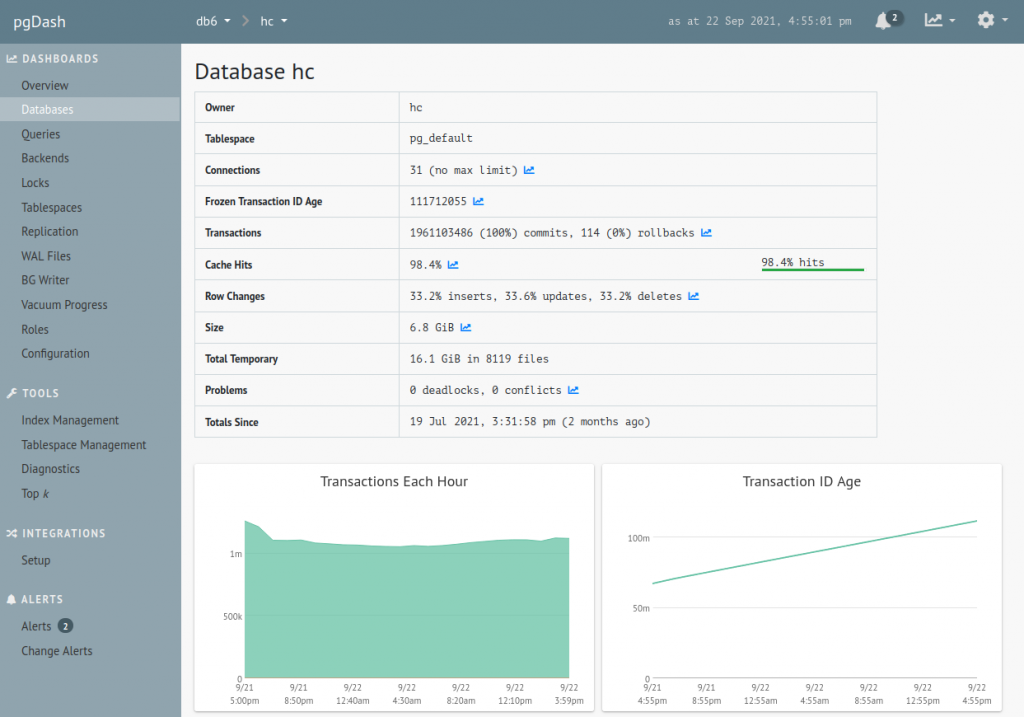
I am currently trialing pgmetrics and pgDash for monitoring PostgreSQL databases. Here are my notes on it.
pgmetrics is a command-line tool you point at a PostgreSQL cluster and it spits out statistics and diagnostics in a text or JSON format. It is a standalone binary written in Go, and it is open source. Here is a sample pgmetrics report.
RapidLoop, the company that develops pgmetrics, also runs pgDash – a web service that collects reports generated by pgmetrics and displays them in a web UI. pgDash is a hosted web service and has a monthly cost.
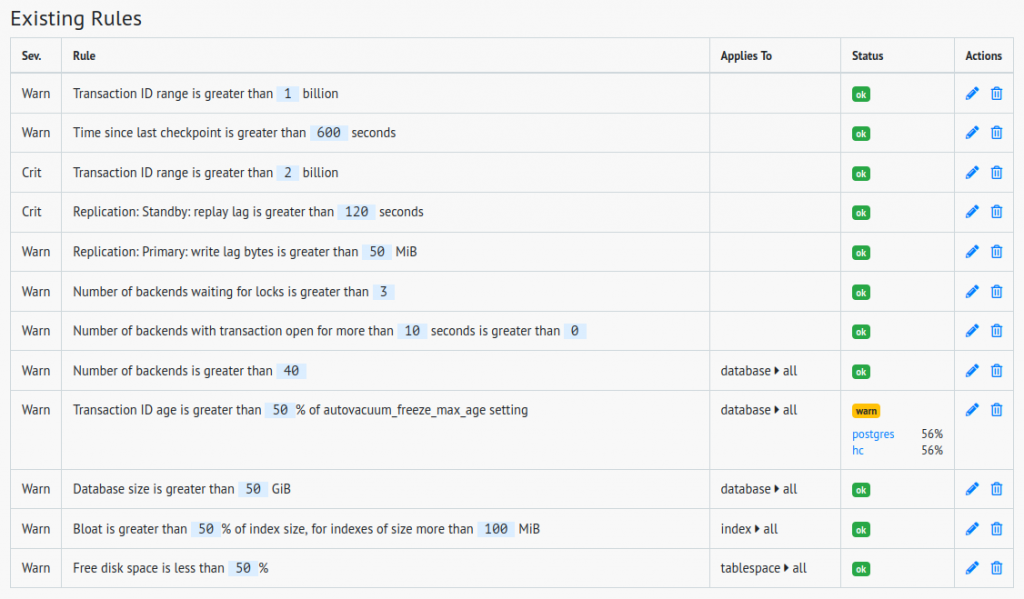
pgDash also supports alerting. For an idea of the types of alerting rules pgDash supports, here are the rules I have currently set up. This is my first go at it, the rules will likely need tweaking:
First Steps
Here’s how you run pgmetrics:
pgmetrics --no-password <dbname>
This produces a neatly formatted plain text report. To produce output in JSON format, add “-f json”:
pgmetrics --no-password -f json <dbname>
Note: I’m running pgmetrics on the database host as the “postgres” system user. pgmetrics can also connect to the database over the network. If you specify the <dbname> parameter, pgmetrics will return detailed statistics about every table for the specified database. This parameter is optional, and you can also use it multiple times:
The next task is to submit the pgmetrics output to the pgDash API. pgDash provides a CLI tool “pgdash” for submitting the reports to their API. pgmetrics output can be piped straight into it:
Assuming the “pgdash” tool just POSTs the report to an HTTP API, would it be possible to replace it with curl? I contacted pgDash support with this question. Their answer – it is not officially supported, but yes, it can be done. The pgDash API endpoint is https://app.pgdash.io/api/v1/report, and it expects the payload in the following form:
The next step would have been to add curl parameters for retries and timeout, but my hack was starting to look too much like a hack, so I switched back to the pgdash CLI tool (which is open-source, by the way).
Cron
So far, I had assembled a command that collects database metrics, and submits them to pgDash. Here it is again:
Next, I wanted to run this automatically, on regular schedule. The obvious way to do that is a cron job. Logged in as the “postgres” system user, I ran “crontab -e” and added this line in the editor window (replacing the <dbname>, <api-keys> and <server-name> placeholders with the actual values, of course):
Note: cron doesn’t support line continuations with “\”, so the entire command has to be a single line.
On my system, the “pgmetrics” and “pgdash” binaries are in /usr/local/bin. I added /usr/local/bin to cron’s PATH, which let me clean up the command a little:
With this in place, the pgDash web service was getting a fresh report every 5 minutes. But what would happen if the cron job somehow broke? Would pgDash detect the absence of new reports, would it alert me about it? I asked pgDash support about this too, and the answer is no. The suggested solution is to use an external tool to monitor the cron job execution. No worries – as it happens, I have just the tool for this! Let’s add Healthchecks.io to the mix.
How to Watch the Watchmen
The easiest way to set up monitoring for a cron job is to create a new Check in Healthchecks.io, copy its ping URL, and add a curl call to the copied URL at the end of the normal cron command.
In the following example I am using line continuations for readability, but, again, in the actual crontab the command would need to all be on a single line:
Here’s how this works. The final curl call runs only if pgdash exits with exit status 0. curl makes an HTTP GET request to hc-ping.com, and Healthchecks.io registers it as a “success” signal. As long as the success signals arrive on schedule, Healthchecks.io stays quiet. When a success signal doesn’t arrive on time, Healthchecks.io sends out alerts. This is already functional, but I had a few improvements in mind:
Measure job execution time by requesting https://hc-ping.com/<uuid>/start before pgmetrics runs
If pgmetrics or pgdash exits with a non-zero exit status, signal a failure by sending a request to https://hc-ping.com/<uuid>/fail
Capture the command’s output, and send it along with the success or failure signal
If a request to hc-ping.com fails or times out, retry it a few times
All of this can be done in a shell script, and even in a shell one-liner, but a simpler option is to use runitor:
runitor -uuid <uuid> -- <command goes here>
runitor takes care of all of the above – it sends the start signal, it captures stdout and stderr, and it signals success or failure depending on the command’s exit status.
The slug format is a new feature and I wanted to dog-food it here. runitor supports the slug format starting from version v0.9.0-beta.1. It accepts the ping key and the slug via command line parameters like so:
Note: my actual database name is “hc”, the server name is “db7”, and the check’s slug is “db7-pgmetrics”. In the remaining code samples, I’ll use these values instead of placeholders. The API keys in the samples are made up though.
Here’s the cron job definition, updated to use slug URLs:
This way, the PING_KEY and PGDASH_KEY values don’t get logged to syslog every time the cron job runs. It also looks cleaner.
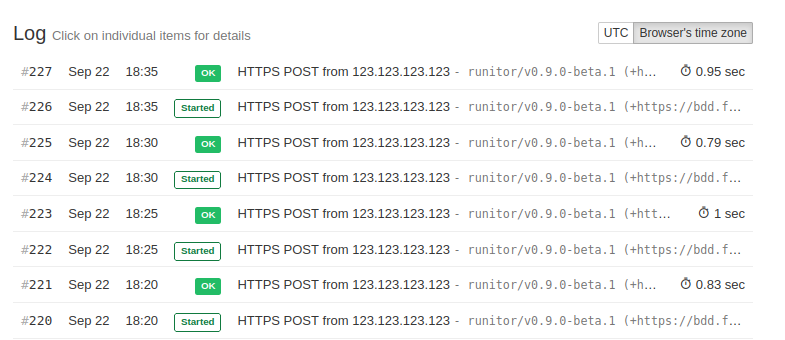
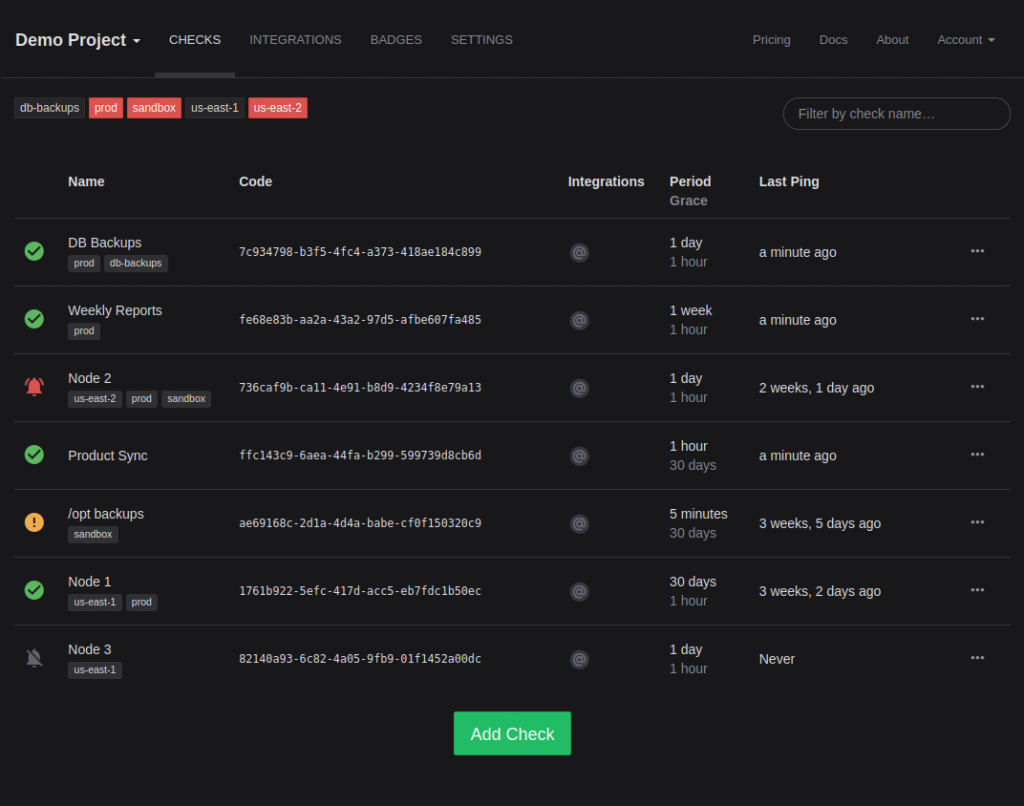
Time to test this setup. In the happy case, where pgmetrics, pgdash, and runitor all run with no issues, Healthchecks.io shows the start and success signal arriving neatly every 5 minutes:
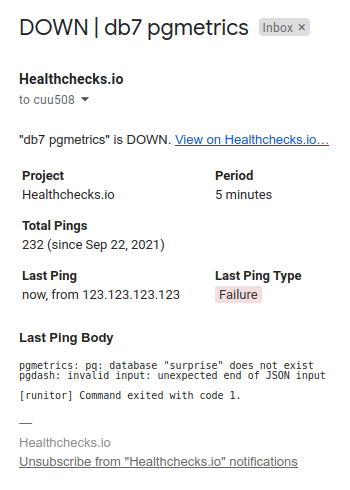
I tested the case where pgmetrics exits with a non-zero exit code. I simulated this by changing the database name to “surprise”, which does not exist. After the next cron job run, I got an email notification from Healthchecks.io:
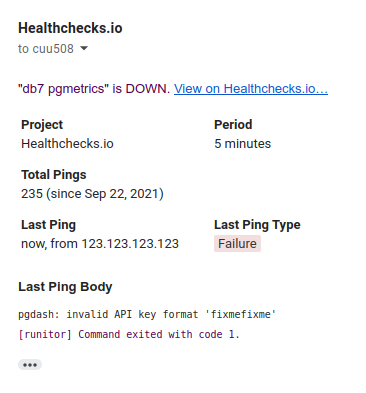
I also tested the case where pgdash fails. I simulated this by changing the pgDash API key to an invalid one:
The last thing left to handle was automated provisioning of the cron job.
Automated Provisioning
The next time I set up a new database server, I don’t want to copy binaries and edit crontab by hand. I want this automated. First, here’s my template for the cron job:
And here’s the Fabric task which uploads binaries and installs the cron job on the remote server:
def pgdash():
    # this loads secrets from an encrypted file
    # into a global variable env.vault
    require_vault()

    # this uploads the binary executables.
    # cannot use f-strings here because Fabric 1.x uses Python 2.7 (yep)
    # the require.file command comes from a helper library, fabtools
    for name in ["pgdash", "pgmetrics", "runitor"]:
        require.file("/usr/local/bin/" + name, source="files/" + name, mode="755")

    ctx = {"HOSTNAME": get_hostname()}
    ctx.update(env.vault)

    # read and fill out the template, upload it to a temporary
    # file on the remote server
    require.files.template_file(
        "/tmp/postgres-crontab",
        template_source="files/postgres-crontab.tmpl",
        context=ctx,
    )

    # install the crontab and delete the temporary file
    sudo("crontab /tmp/postgres-crontab", user="postgres")
    run("rm /tmp/postgres-crontab")
One interesting thing here is how the cron job definition gets installed. When I set up a new cron job interactively, I run “crontab -e” and a text editor opens. I type or paste the new job, save, and exit the editor. This method would be hard to automate, but there is an automation-friendly way:
crontab <filename>
This replaces the current user’s existing cron jobs with whatever is in the file referenced by <filename>. Nice and simple!
I now have continuous pgDash monitoring set up for Healthchecks.io primary and standby database servers. I can look at the reported data and see which indexes are bloated, how far away is the transaction ID exhaustion event, which Postgres configuration settings need tuning, and all that good stuff. Thanks for reading and happy monitoring!
Time flies and Healthchecks.io is already 6 years old. Here’s a quick review of notable recent events and the project’s current state.
Database Migration
Healthchecks.io database used to run PostgreSQL 10. In March 2021 I migrated it to PostgreSQL 13. For the upgrade method, I used logical replication, as suggested on Reddit.
The idea is to set up a Postgres 13 replica, replicate the data to it, and then failover to it. But there are of course several gotchas and everything has to be thoroughly tested before. I found this guide and worked through it. I made a step-by-step migration plan and tested it on Vagrant VMs. I then iteratively improved the plan and did more test migrations until everything was working smoothly, and I knew the order of commands to run almost by heart.
Then it was time to announce maintenance, provision new hardware (two Ryzen 5950X machines: 16 cores, 64GB RAM, and 2x4TB NVMe drives for each, aw yiss), set them up, and do the migration for real. And it all worked as planned!
Wireguard
Hetzner has a feature called vSwitch for setting up private networks between hosts. I had it set up, and the infrastructure servers (load balancers, app servers, databases) were communicating between themselves over internal IPs.
In my experience, vSwitch turned out to be less reliable than the regular network. There was an incident where the vSwitch network interface on one machine was not working while the public interface was still fine. The issue got resolved after contacting Hetzner support, but I decided to go back to using public interfaces. I used firewall rules to control which IPs can connect to which ports.
Although Hetzner support says their internal network is secure, and customers cannot snoop on other customer traffic, I wanted to reduce the trust placed on Hetzner, and set up Wireguard tunnels between the servers. I did not use Tailscale or anything fancy like that, just a few Fabric recipes for initial setup, and for updating peers (when a server is added or removed from the network).
A small gotcha here was services not always automatically starting after system reboot. I had to tweak systemd service definitions to make sure network-dependent services (nginx, postgres) start only after Wireguard has initialized.
Self-hosted Postgres, bespoke Wireguard tunnels, can you hear the innovation tokens burning up yet? 🙂
Signal
Healthchecks.io has had a Signal integration for a couple months now. I think Signal has been the most tricky to implement and set up so far. Unlike most other services, Signal does not have a public HTTP API you can call to send messages. Instead, you have to run a local Signal client locally and communicate with it to send the messages. Luckily there is signal-cli, a wrapper around the official Signal Java client library. I run signal-cli under a separate OS user account, and Healthchecks communicates with it over DBus (details). Multiple app servers are sending out notifications, each one runs signal-cli, and all signal-cli instances are linked to a single Signal account (phone number).
After deploying and announcing the Signal integration, I was glad to see a quick uptake:
SMS was introduced in July 2017, and has approx. 500 configured integrations
WhatsApp was introduced in July 2019, and has approx. 450 configured integrations
Signal was introduced in January 2021, and has approx. 350 configured integrations
When looking at these numbers, one factor to keep in mind is that SMS and WhatsApp have a minimal sending quota in free accounts (because sending these notifications costs money), while Signal is unrestricted.
Dark Mode
Healthchecks now has an optional dark theme. You can activate it in Account Settings – Appearance.
Implementing dark mode was, as expected, lots of work, and there is more work left. Aside from the obvious – page background, body text, panels, buttons – various other bits needed theming, each in their specific way:
Bootstrap components like menus
Selectize dropdowns
Period and Grace sliders
The icon font with integration logos
Syntax highlighting for code samples
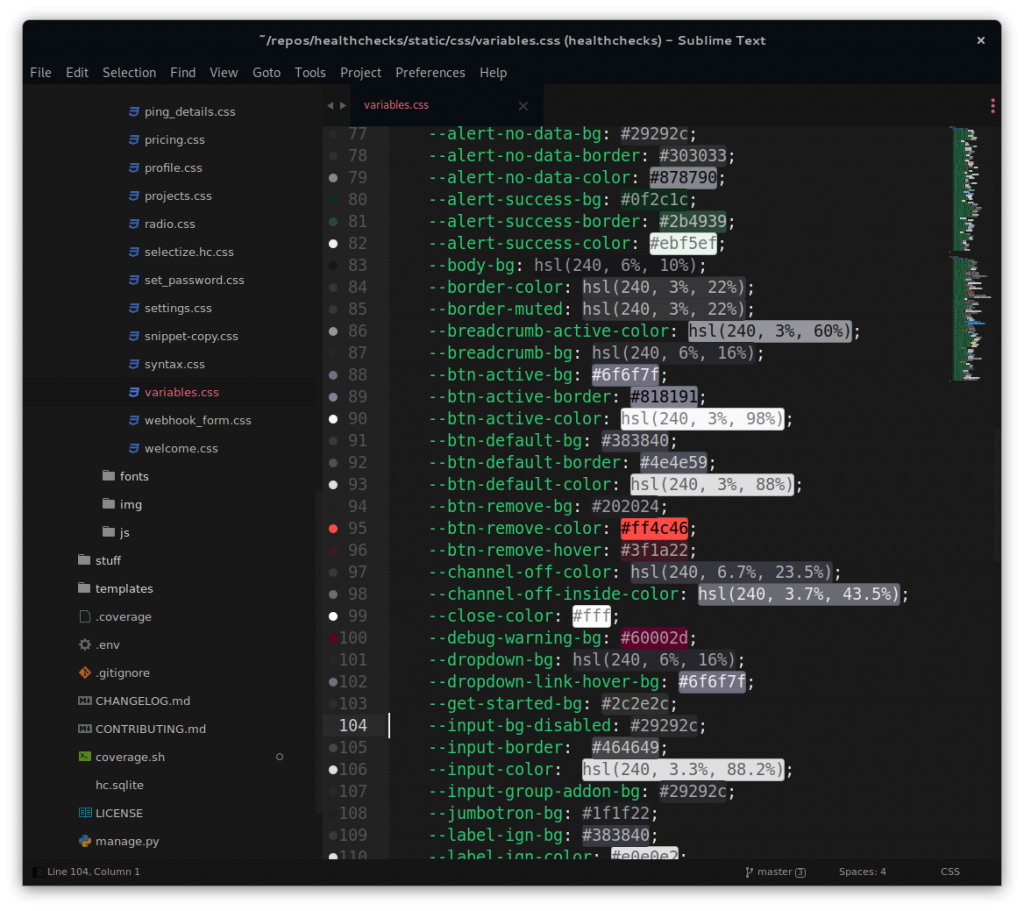
It was interesting work. I use Sublime Text, and found the Color Highlighter plugin very handy when working with colors:
After publishing the initial dark mode implementation, I was happy to see people starting to use it. It was not work-for-nothing, a significant number of users prefer the dark mode over the default!
Fuzz Testing croniter, Introducing cronsim
Healthchecks.io had an incident where a single bad cron expression caused system-wide issues. The bad cron expression was making the croniter library throw an unexpected exception. This lead to a crash-restart loop in the notification sending process. The initial fix was to add “try .. except” around croniter calls, but I later also spent time fuzz testing croniter. I found and filed several crashing issues. The worst one was to do with expressions like: 0-1000000000 * * * *. By varying the number of zeroes I could get the python process to use up all system memory and eventually crash. I reported this issue privately in January 2021, and the maintainer fixed it the same day.
After diving around the croniter code, I wanted to try my hand at writing a slimmed-down version. And so I did, welcome cronsim. It is 250 lines of code, and it does just one thing: it takes a cron expression and returns a datetime iterator.
I’ve tested cronsim with a large corpus of cron expressions, and, for every expression I tested, it produced the same results as the croniter library. Except for one case, where both libraries produce incorrect results: the handling of daylight saving time (DST) transitions. Getting this right has been surprisingly hard, and I have not cracked this problem yet. But I did come up with a cool toy: I installed a Debian system inside qemu (instructions) and used qemu emulator flags to speed up the system clock inside the VM. With this contraption, I can test cron expressions with the actual running Debian cron daemon, and see results in minutes instead of hours or days. Anyway, more work is needed here.
Development Roadmap
The default plan is to continue making small iterative improvements.
In the background, I am also bouncing around ideas around product architecture and reliability. One area is the reliability of the Ping API. Whenever a client makes an HTTP request to a ping endpoint, there is a small, but non-zero probability the request will fail due to TCP packet loss. The probability increases as the distance from the client to the server increases. It would be ideal to put the server close to the client. There are different ways to go about this and lots to explore. One potential building block is CockroachDB. Very impressively, in my testing Healthchecks test suite passed with CockroachDB backend out of the box. It Just Worked, but to make it perform well, I would need to make several changes. For example, the big and write-heavy “api_ping” table has an auto-incrementing integer primary key. It would not work well in a distributed database.
Healthchecks.io the Business
I’ve reduced my other work commitments, and Healthchecks.io is now my main occupation and my main source of income. Not quite “full-time” yet, but getting there!
I regularly update the About page with running stats (ping volume, the number of users, revenue, …), you can check out the numbers there!
As the project’s revenue slowly creeps up, I start to get more regular “Acquisition?” emails. I don’t have plans to sell the project in the foreseeable future. Too much work and soul put into it, and I also simply enjoy working on it and running it (aside from dealing with infra outages I have no control over, these are not fun at all!).
That’s it for now, thank you for reading! Here’s to another 6 years, and in the closing here’s a complimentary picture of me attacking a hornet nest with a pressure washer:
Here’s is a look back at the privacy-related changes and milestones of the Healthchecks.io website. If you also run a small SaaS, feel free to compare the notes. If you have suggestions or questions, please let me know!
Dec 2015, Published Initial Privacy Policy
I was setting up payments via Braintree, and it required my site to have a privacy policy.
At the time, anything privacy-related was entirely off my radar. The thought “I need to formulate and publish a privacy policy” had not even crossed my mind.
I used an online service, privacypolicies.com, to generate a generic Privacy Policy document. I added it to the site, and that satisfied the Braintree requirement.
Jun 2016, Published Terms & Conditions
I was adding a PayPal payment option, and PayPal additionally required the site to have Terms & Conditions.
I used TermsFeed to generate a generic Terms & Conditions document for $50.
May 2018, Updated Privacy Policy for GDPR
Leading up to the GDPR coming into force, I was looking at what I needed to do to prepare. On the technical side, the site seemed to already be in good shape. It was not using any advertising or tracking cookies. It was not collecting any unneeded information. It was using the collected information only in the intended way (email addresses to send notifications, phone numbers to send SMS notifications, etc.). The “Close Account” function was there, letting users remove their data from Healthchecks.io systems at any time, without assistance from Support (me).
The Privacy Policy, however, seemed to need updating. Figuring out what needs to go in the privacy policy was frustrating. I spent a fair bit of time comparing other companies’ privacy policies, looking for templates, and reading conflicting advice. In the end, I went to Fiverr and looked up somebody who claimed to be a lawyer specializing in GDPR. I ordered a custom, GDPR-compliant Privacy Policy for $250 from them. I was then directed to a form with a number of questions about my company, and, sometime later, they had produced the document.
The new Privacy Policy was, unsurprisingly, a template job. If I took a sentence from it and plugged it in Google, I could find other very similar privacy policies. But that’s to be expected for the price, and it was better than what I had before. So I went ahead and published it.
Mar 2019, Implemented Inactive Account Deletion
Data is not an asset, it is a liability.
I implemented a system that automatically removes abandoned accounts. If an account is inactive for a full year, the system sends an email notification. The notification basically says, “Sign in in the next 30 days, or we will delete your account”. If the account is still inactive 30 days later, the system deletes the account.
There is a neat side-benefit to sending the deletion notices: they can sometimes “reactivate” old users. I haven’t investigated how often that happens, though.
Jun 2019 Stopped Using Cloudflare Load Balancing
I started running my own Haproxy instances on bare metal servers. I did this mainly because I wanted a better and lower-level control of the load balancers. But it also improved the privacy aspects: Cloudflare was no longer proxying my traffic. I’m still using Cloudflare as a DNS provider to this day.
Note: I was and still am a fan of Cloudflare. Nevertheless, there is one less thing to worry about GDPR-wise if the traffic does not go through them.
Jul 2019, Rewrote Privacy Policy
I wanted to add a list of data sub-processors to the Privacy Policy but ended up redoing it entirely. I used UptimeRobot’s privacy policy as a base (with their permission) and went at editing it. This time, I used Fiverr services only for proofreading my edited version.
Sep 2019, Improved Database Backups
Every day, the database server creates a full database dump, encrypts it, and uploads it to an S3 bucket. It does this in a cron job. (And, of course, I have monitoring set up for the cron job!)
I made a few DevOps-y improvements there:
Moved the storage location from us-east-1 (N. Virginia) to eu-central-1 (Frankfurt)
Added a lifecycle rule to delete backups older than 45 days. That’s one less thing I need to do manually every month!
May 2020, Statuspage.io Cookie Saga
I’ve written a separate blog post about this, but the short version is: I discovered that status.healthchecks.io sets tracking cookies. That was not OK. Several months and several hundred emails later, Atlassian removed the tracking cookies.
Jul 2020, Migrated Email Sending to AWS EU Region
Healthchecks.io uses AWS SES to send email notifications. Like backups and S3, I decided to switch from us-east-1, their default region, to eu-central-1. I was not aware of Schrems II at the time; I only wanted to move the SMTP servers closer to my servers for reliability.
There is a privacy benefit on the paper, although I’m sure AWS engineers in the U.S. can access AWS infrastructure in the EU, so the Schrems II concerns still apply.
Sep 2020, Removed Customer Data From Accounting Reports
I outsource Healthchecks.io accounting to a local accounting company. At the start of every month, I collect all invoices and bank statements and send them off. They process the documents and prepare the tax reports.
I realized that some of the statements contain personal information. For example, PayPal’s monthly statement contains customer names and email addresses. I checked with the accountants, and they confirmed they don’t need the names or emails for anything. So, I started scrubbing the personal information from the statements before sending them each month.
Nov 2020, Closed ChartMogul account
In light of Schrems II, I was reviewing the list of Healthchecks.io data sub-processors based in the U.S.; there were four:
Amazon (emails)
Twilio (SMS, WhatsApp, voice calls)
Braintree / PayPal (subscription management, CC and PayPal payments)
ChartMogul (revenue analytics)
The first three were essential and not easy to replace. ChartMogul, however, was merely nice-to-have. It was also the only one with no mention of Standard Contractual Clauses anywhere in its Data Processing Agreement. So I decided to stop using it and closed my account.
Dec 2020, Migrated from Zoho Mail & GMail to Fastmail
For receiving and sending email at contact@healthchecks.io, I had cobbled together a Zoho and Gmail setup: Zoho was receiving email on my custom domain and forwaring it to my personal Gmail address. This was back in 2015 when the service was not yet generating any revenue.
This winter holiday break, I moved email hosting to Fastmail ($50 / year). It’s a simpler setup, and I am more comfortable as a paying customer of Fastmail than a free user of Zoho and Google.
And this is where we are now. Now, why do I care about privacy anyway? I’ve thought about it.
In my experience, a company’s privacy practices are an indicator of its general “wholesomeness.” An obnoxious cookie banner is a sign of more dark patterns to come. On the other hand, privacy-first companies tend to treat their customers with respect in other aspects as well.
And the other thing. While most users probably won’t ever read the Privacy Policy or care what email hosting Healthchecks.io uses, if it’s important to me, then I work on it. As Ocramius said in their Why I do open source? article:
This corner of the codeverse is mine to decide where engineering steers towards, and this capability is extremely precious to me.
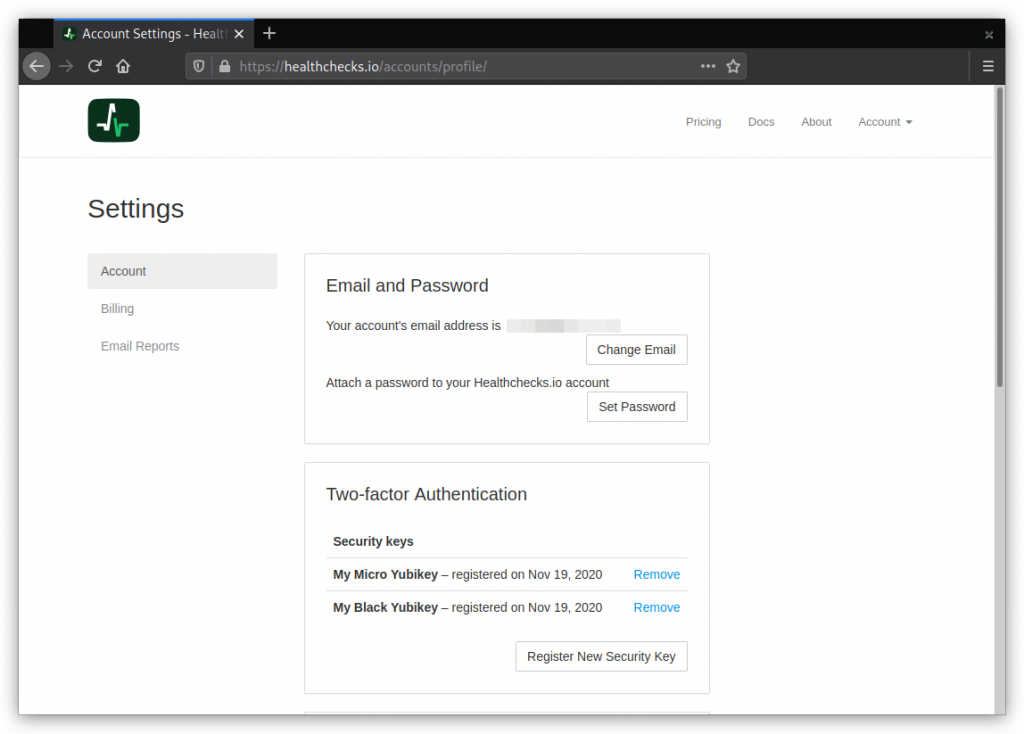
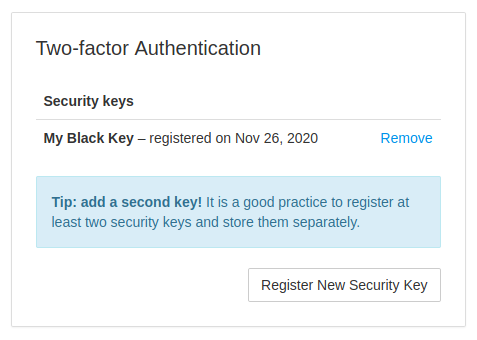
Healthchecks.io now supports two-factor authentication using the WebAuthn standard. Here is how it works: in the Account Settings page, users can see their registered FIDO2 security keys and register new ones:
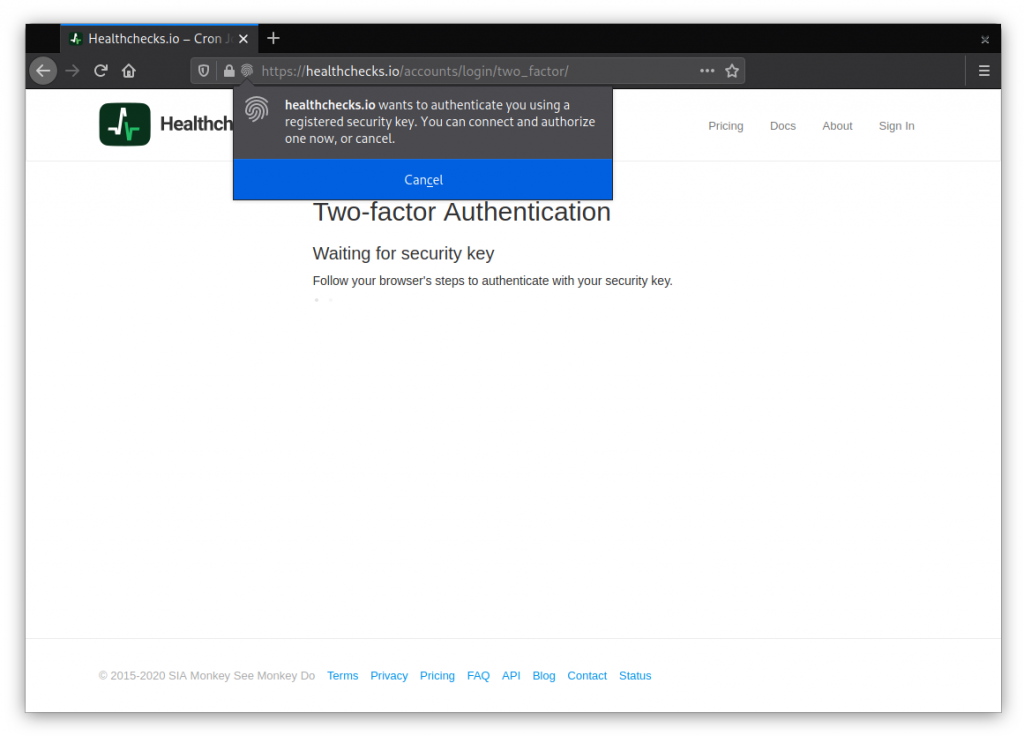
When logging in, if the account has any registered keys, Healthchecks requires the user to authenticate with one of their keys:
Users can register multiple keys, users can give their keys nicknames, and users can remove registered keys. Removing the last key deactivates two-factor authentication. And, from the user’s perspective, for now at least, that’s mostly it!
There are some nuances on the UI side, and there are quite a few subtle things on the technical side to deal with. Here are a few examples.
If the user has just one registered security key, losing the key means losing access to their account. It is good to have a second, backup key and store it separately. I added a note in the UI about that:
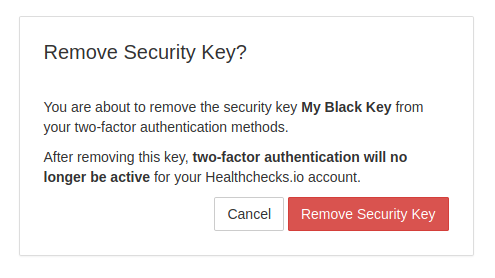
When the user removes their last security key, they are effectively also disabling the two-factor authentication for their account, and should be aware of it:
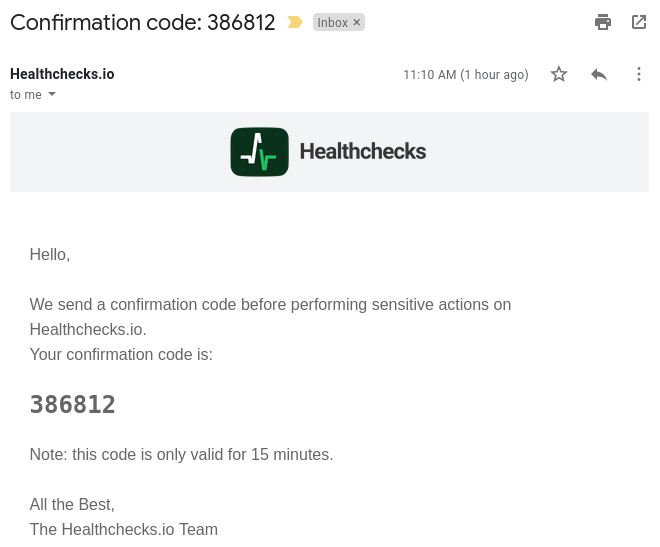
In a high-risk situations (add security key, remove security key, change email address, change password, close account) the service should require the user to re-authenticate. My solution here is to send a six-digit confirmation code to the user’s email and require the user to enter it back.
When the user enters the correct code, they can continue to the sensitive action, and will not be asked to enter another code for the next 30 minutes. The code entry form uses rate limiting to prevent brute-force attacks.
For implementation, I used the fido2 Python library by Yubico. They provide a sample Relying Party implementation, which I used as a reference. Yubico also provides a WebAuthn Developer Guide. It is a good resource with the right level of detail, and I ended up reading and re-reading it multiple times.
This is a preliminary implementation. I’ve personally tested it with several types of security keys on Firefox and Chrome. If you experience any issues with registering or authenticating with your security key(s), please report it!
Will there be support for other 2FA methods: SMS, TOTP?
SMS – no. TOTP – potentially, if there is significant demand for it.
That’s all for now, thanks for reading! Pēteris, Healthchecks.io
I recently found out Travis CI is ending its free-for-opensource offering, and looked at the alternatives. I recently got badly burned by giving an external CI service access to my repositories, so I am now wary of giving any service any access to important accounts. Github Actions, being a part of Github, therefore looked attractive to me.
I had no experience with Github Actions going in. I have now spent maybe 4 hours total tinkering with it. So take this as “first impressions,” not “this is how you should do it.” I’m a complete newbie to Github Actions, and it is just fun to write about things you have just discovered and are starting to learn.
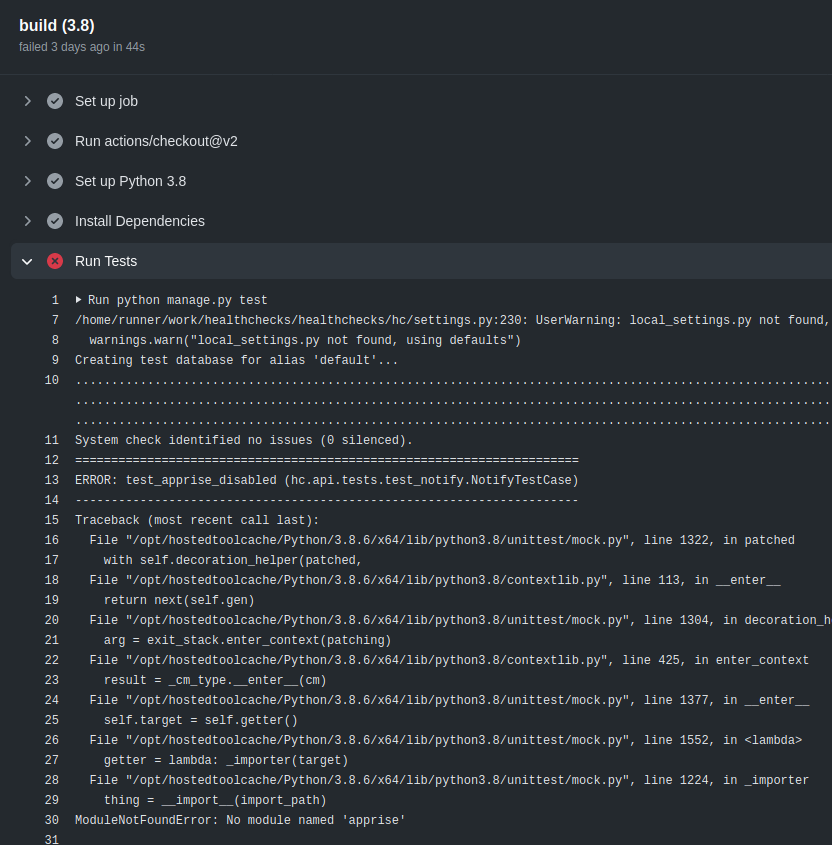
My objective is to run the Django test suite on every commit. Ideally, run it multiple times with different combinations of Python versions (3.6, 3.7, 3.8) and database backends (SQLite, PostgreSQL, MySQL). I found a starter template, added it in .github/workflows/django.yml, pushed the changes, and it almost worked!
Everything looked almost good except for a couple missing dependencies. A couple of dependencies for optional features (apprise, braintree, mysqlclient) are not listed in requirements.txt, but are needed for running the full test suite. After adding an extra “pip install” line in the workflow, the tests ran with no issues.
Adding Databases
If you run the Healthchecks test suite with its default configuration, it uses SQLite as the database backend which usually Just Works. You can tell Healthchecks to use PostgreSQL or MySQL backends instead by setting environment variables.
Looking at Github Actions documentation suggested I should use service containers. By using special syntax, you tell Github Actions to start a database in a Docker container before the the rest of the workflow execution starts. You then pass environment variables with the database credentials (host, port, username, password) to Healthchecks. It took me a few failed attempts to get running, but I got it figured out relatively quickly:
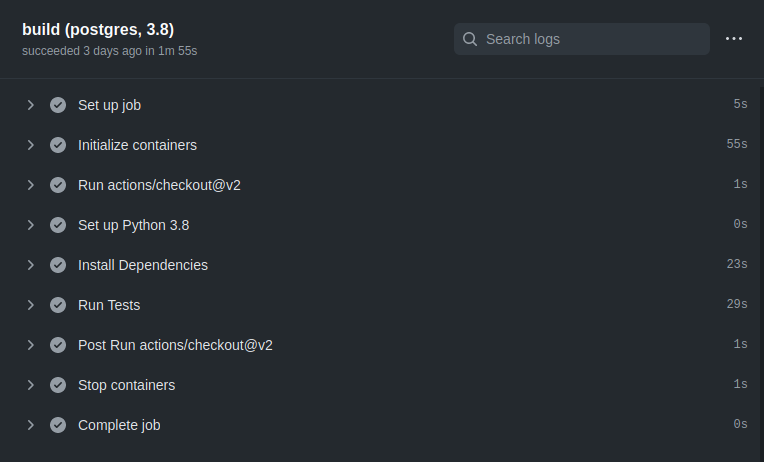
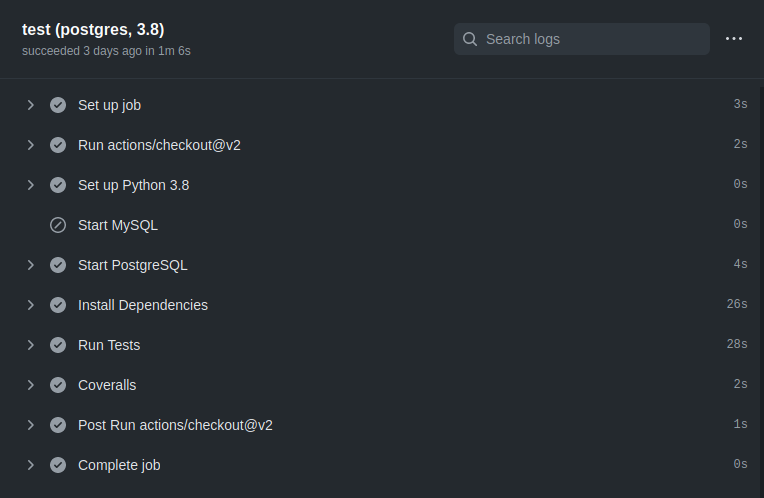
One thing that bugged me was the database containers took around one minute to initialize. Additionally, both the PostgreSQL and MySQL would initialize on all jobs, even the jobs only needing SQLite. This is not a huge issue, but, my inner hacker still wanted to see if the workflow can be made more efficient. With a little research, I found the Github Actions runner images come with various preinstalled software. For example, the “ubuntu-20.04” image I was using has both MySQL 8.0.22 and PostgreSQL 13.1 preinstalled. If you are not picky about database versions, these could be good enough.
I also soon found the install scripts Github uses to install and configure the extra software. For example, this is the script used for installing postgres. One useful piece of information I got from looking at the script is: it does not set up any default passwords and does not make any changes to pg_hba.conf. Therefore I would need to take care of setting up authentication myself.
I dropped the services section and added new steps for starting the preinstalled databases. I used the if conditionals to only start the databases when needed:
There is more time to be gained by optimizing the “Install Dependencies” step. Github Actions has a cache action which caches specific filesystem paths between job runs. One could figure out the precise location where pip installs packages and cache it. But this is where I decided it was “good enough” and merged the workflow configuration into the main Healthchecks repository.
In summary, first impressions: messing with Github Actions is good fun. The workflow syntax documentation is good to get a quick idea of what is possible. The workflow definition ends up being longer than the old Travis configuration, but I think the extra flexibility is worth it.