Recently, Codeship reported a security incident: a database containing their production data had been exposed for over a year.
I have a Codeship account. I also have a Bitbucket account, and my Codeship account was authorized to access it. In the Bitbucket account, I have a private repository with various secrets (API keys, access tokens) that Healthchecks.io production environment uses to talk with the database and external services.
I was storing the secrets in the Bitbucket in an unencrypted form. If leaked, they would allow an attacker to do things like:
- send emails impersonating Healthchecks.io (bad)
- send SMS messages from Healthchecks.io number (bad, can get expensive)
- access Healthchecks.io customers’ billing addresses (very bad)
I have found no evidence that my private Bitbucket account was accessed or any secrets leaked. At the same time, I cannot conclusively prove it was not possible for the secrets to leak.
I debated with myself whether I should write this post. It boils down to a moral dilemma: do I write a full disclosure about what is likely a non-event, and risk a reputation hit? Or do I handle it quietly and just let it pass?
Codeship and Bitbucket
I found Codeship’s security notification on October 2 in my spam folder. According to Codeship, their database was exposed from June 2019 to June 2020. There is evidence that the attacker was actively using data from their database.
I am not using Codeship for anything Healthchecks-related, but I had granted Codeship access to my Bitbucket account for an unrelated project. The grant was required to set up automatic Codeship builds on each Bitbucket commit. Unfortunately, it looks like Codeship asks for way too many permissions:
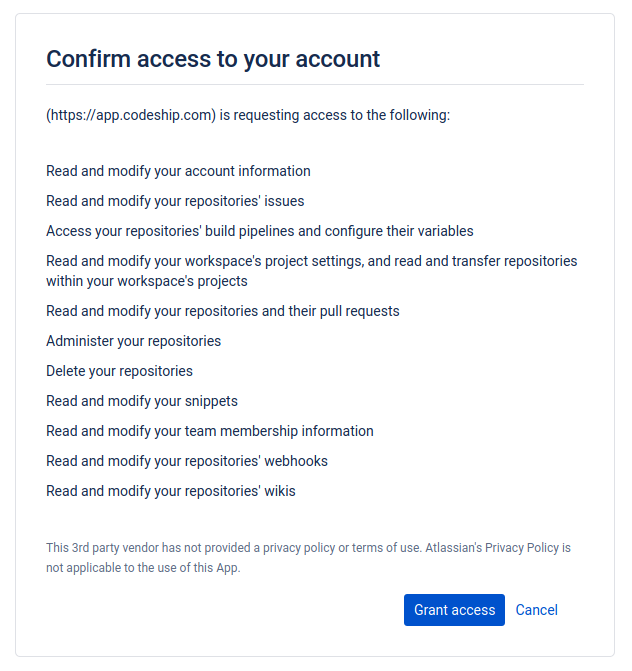
I wish I had read this carefully and thought about the implications when I was setting this up back in January 2016.
After granting access, Bitbucket gives Codeship an OAuth access token, which ends up in Codeship’s database. Using the OAuth token, Codeship (or its attacker) can access and manipulate the user’s repositories.
After becoming aware of the incident, I revoked Codeship’s access from Bitbucket, and checked all my repositories for any rogue access keys or unexpected changes. I asked Codeship support if the Bitbucket access token could have been exposed. They said:
The Bitbucket token was potentially exposed. I would recommend revoking this token and looking through your repo history for any suspicious activity, although so far we have not heard of any Bitbucket-focused activity.
I asked Bitbucket support for API call logs. They did prepare and send a report, but unfortunately they only have data from the previous 3-4 weeks.
Healthchecks.io Secrets in Bitbucket
In Bitbucket, I have a private repository with deployment scripts. These are Fabric scripts for bootstrapping new machines, deploying and updating software, and various maintenance tasks. The repository also contains a local_settings.py file with all the production API keys and tokens the Healthchecks app needs to run.
Storing unencrypted secrets in version control is, of course, a mistake on my part. I have now fixed this and am now using Mozilla’s sops to encrypt the secrets. The GPG encryption key is on a Yubikey.
Rotating Secrets
Rotating all secrets was the most time consuming and stress-inducing part. Most of the secrets I had never rotated before, so I had to figure out a safe update procedure for each.
Database. One of the secrets was the PostgreSQL database password. Access to the database is also restricted at the firewall and the pg_hba level, so the password alone is not enough to access the database. Of course, I still wanted to change the password. The procedure was:
- Create a secondary database user
- Switch all services to use the secondary user
- Update the password of the primary database user
- Switch all services back to use the primary user
Sounds simple enough, but it involved lots of planning, checking, and double-checking. White knuckles and lots of coffees.
Services that support seamless key rotation: AWS SMTP credentials, Braintree, Matrix, Pushbullet, Sentry, Twilio. The process:
- Create a secondary API key while the primary key still works
- Update all services to use the secondary key
- Promote the secondary token to the primary (or delete the primary, leaving just one)
I updated the keys one-by-one, checking everything after each step. In some cases, I kept the old key active for a couple days to make sure no production system was still using it.
Services that only support resetting the keys in place: Discord, LINE Notify, OpsDash, Pushover, Slack, Telegram. For these, the process is “quick hands.” Regenerate the secret, then update the production machines with the new secret as quickly as possible. Again, going through them one by one and testing everything after each change.
SSL certificates. I had the SSL certificates for healthchecks.io, hc-ping.com, and hchk.io purchased from Namecheap. They do support reissuing certificates and revoking the old ones. One complication here was that, for each hostname, I was using both RSA and ECDSA certificates (provisioned as instructed by Namecheap: issue RSA first, then reissue as ECDSA). To minimize the chance of making a mistake, I decided to purchase and deploy new certificates from a different provider and only afterwards revoke the existing certificates. I discovered SSLMate, and got the certificates from them. I liked the process of ordering certificates from the command line. It’s a big improvement over the usual process of copy-pasting CSRs around. I installed the new certificates, tested the setup thoroughly, and revoked the old certificates a few days later.
There is still one task on my list: Django’s SECRET_KEY setting. I’m investigating the impact of changing it. One issue here is that Healthchecks.io uses SECRET_KEY as one component in a hash function when generating the badge URLs. Naively changing SECRET_KEY would invalidate all existing badge URLs. Coupling badge URL generation and SECRET_KEY was a seemingly small design decision, and now it comes biting me in the rear years later! I will deal with this but wanted to get this post out with no further delay.
Closing Thoughts
As I wrote in the beginning, I have no evidence that any Healthchecks.io secrets have been leaked or used. Still, they should have not been accessible to third parties (Bitbucket and Codeship) in the first place – I’ve now fixed this mistake.
As always, if you have any questions, please write to contact@healthchecks.io.
– Pēteris, Healthchecks.io