The Healthchecks.io system status page at status.healthchecks.io recently received a revamp. Here are my notes on the new version.
First up, the components section shows the current and historic status of components:
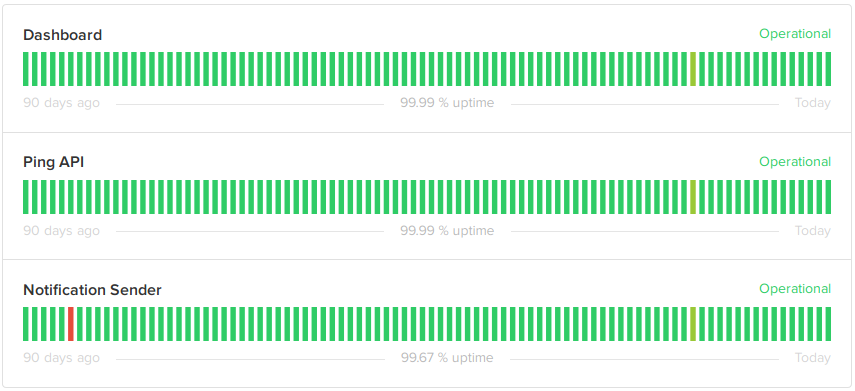
Dashboard shows the status of the main website, healthchecks.io. “Operational” state here means the website responds to HTTP requests, and has a working connection to the PostgreSQL database. Checkly, an external uptime monitoring service, monitors the website and automatically updates the component’s status via Statuspage.io API. Checkly has powerful and flexible webhook notifications which makes this possible.
Ping API shows the status of the ping endpoint, hc-ping.com. “Operational” state means hc-ping.com is responding to HTTP requests and is inserting pings in the database with no excessive delay. Although the ping endpoint and the main website runs on the same physical servers, they use different software. So it makes sense to monitor them separately. The status of this component is updated automatically by Checkly, same as the dashboard.
Notification Sender shows the status of the background process sending out notifications. Status updates of this component are not automated yet.
Below the components is the “System Metrics” section with four metrics.
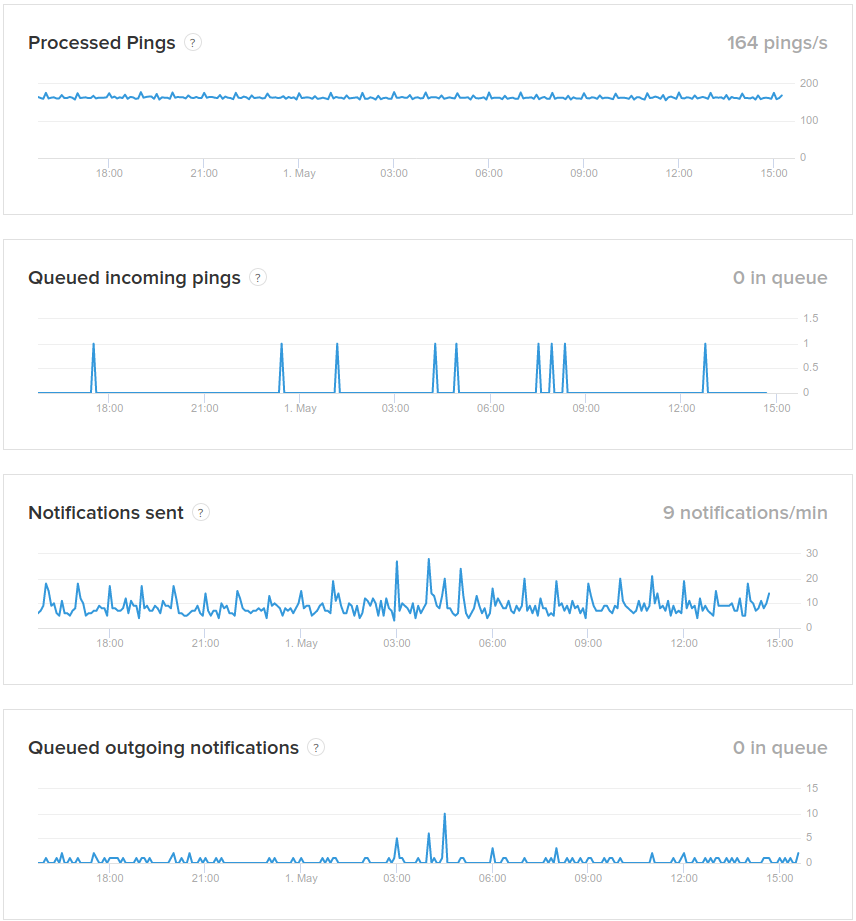
- Processed pings is the number of valid ping requests (valid UUID, not rate limited) processed per second.
- Queued incoming pings is the number of pings that have been received but not yet inserted in the database. A spike suggests either a database problem, or a connectivity issue inside the data center.
- Notifications sent is the number of notifications sent per minute.
- Queued outgoing notifications is the number of scheduled notifications waiting to be sent out. A growing number means either the notification sender is not working, or it cannot keep up.
I used the following criteria for picking the metrics to show:
- The metric should tell something useful about the system.
- The metric should be simple to explain. For example, I internally track a few different “queue dwell time” metrics. They are useful, but it would be hard to explain what they mean precisely, and how to interpret them.
- The metric should be computationally inexpensive to measure. It should not require a heavy database query.
I considered several ways of measuring, aggregating and submitting the metrics. I ultimately went with:
- Each web server exposes a metrics endpoint that an external system can scrape. Here’s a git commit where I added one of the endpoints.
- On an external host, a script runs once per minute (via cron of course). It scrapes metrics data from each web server, then processes and submits it to Statuspage.io using their Metrics API. The script is less than 100 lines long.
If you notice gaps in metrics graphs, it could be because the external metrics collector has failed. There are ways to make the metrics collection more robust, but the current simple setup seems to work fine for now.
The final feature in the status page is Incidents. Currently I have not automated incident creation in any way. The plan is to manually open an incident when I become aware of it, and backdate it as makes sense. To test out the Incidents feature, I backfilled a couple past incidents. For example, Delayed notifications on February 7.
And that is all for now. I hope the new status page does not need to be used often! I will also keep posting outage notifications to @healthchecks_io on Twitter as well.
Happy monitoring and meta-monitoring,
Pēteris,
Healthchecks.io