The Healthchecks.io system status page at status.healthchecks.io recently received a revamp. Here are my notes on the new version.
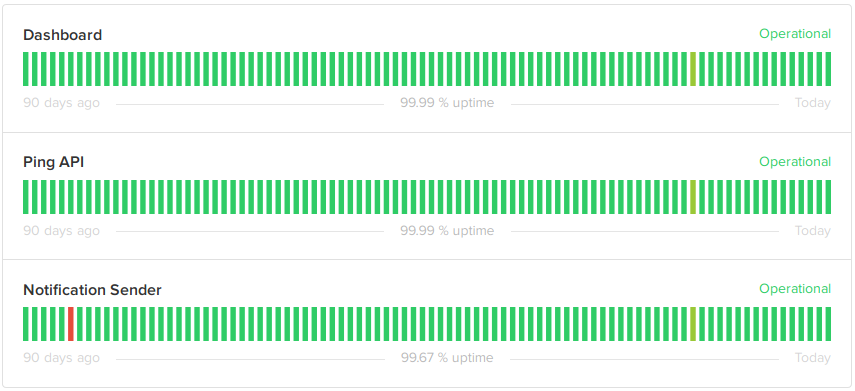
First up, the components section shows the current and historic status of components:
Dashboard shows the status of the main website, healthchecks.io. “Operational” state here means the website responds to HTTP requests, and has a working connection to the PostgreSQL database. Checkly, an external uptime monitoring service, monitors the website and automatically updates the component’s status via Statuspage.io API. Checkly has powerful and flexible webhook notifications which makes this possible.
Ping API shows the status of the ping endpoint, hc-ping.com. “Operational” state means hc-ping.com is responding to HTTP requests and is inserting pings in the database with no excessive delay. Although the ping endpoint and the main website runs on the same physical servers, they use different software. So it makes sense to monitor them separately. The status of this component is updated automatically by Checkly, same as the dashboard.
Notification Sender shows the status of the background process sending out notifications. Status updates of this component are not automated yet.
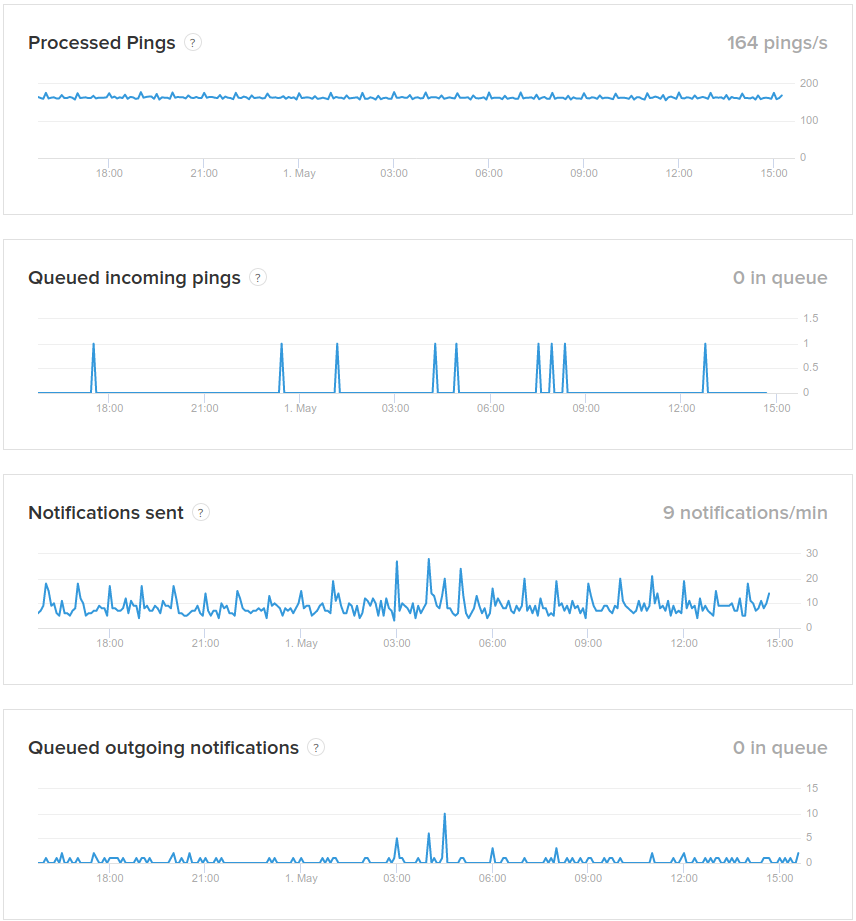
Below the components is the “System Metrics” section with four metrics.
Processed pings is the number of valid ping requests (valid UUID, not rate limited) processed per second.
Queued incoming pings is the number of pings that have been received but not yet inserted in the database. A spike suggests either a database problem, or a connectivity issue inside the data center.
Notifications sent is the number of notifications sent per minute.
Queued outgoing notifications is the number of scheduled notifications waiting to be sent out. A growing number means either the notification sender is not working, or it cannot keep up.
I used the following criteria for picking the metrics to show:
The metric should tell something useful about the system.
The metric should be simple to explain. For example, I internally track a few different “queue dwell time” metrics. They are useful, but it would be hard to explain what they mean precisely, and how to interpret them.
The metric should be computationally inexpensive to measure. It should not require a heavy database query.
I considered several ways of measuring, aggregating and submitting the metrics. I ultimately went with:
Each web server exposes a metrics endpoint that an external system can scrape. Here’s a git commit where I added one of the endpoints.
On an external host, a script runs once per minute (via cron of course). It scrapes metrics data from each web server, then processes and submits it to Statuspage.io using their Metrics API. The script is less than 100 lines long.
If you notice gaps in metrics graphs, it could be because the external metrics collector has failed. There are ways to make the metrics collection more robust, but the current simple setup seems to work fine for now.
The final feature in the status page is Incidents. Currently I have not automated incident creation in any way. The plan is to manually open an incident when I become aware of it, and backdate it as makes sense. To test out the Incidents feature, I backfilled a couple past incidents. For example, Delayed notifications on February 7.
And that is all for now. I hope the new status page does not need to be used often! I will also keep posting outage notifications to @healthchecks_io on Twitter as well.
On February 7, Healthchecks.io experienced an issue with sending notifications. An invalid cron expression slipped into the system, which caused the notification sending jobs to crash and restart in a loop. Timeline (all times are in UTC, and from February 7):
0:37: a check with a bad cron schedule gets created via API
0:41: the check receives its first ping
0:42: one minute later, the notification senders go into a crash-restart loop
1:02: external monitoring alerts go out
7:00: I’ve woken up and found out about the outage
7:28: The invalid cron expression is located and fixed, notification sending resumes
10:00: Deployed mitigations for the “sendalerts” process repeatedly crashing, and stricter cron expression validity checks
This outage started at in the middle of night (2:42 AM local time) and so it took several hours until I found out about it and could jump on to fixing it. During this time, Healthchecks.io was not sending out any notifications (all types: emails, webhooks, Slack alerts, …). On the positive side, the web dashboard, the ping endpoints, the API and the badges were working normally.
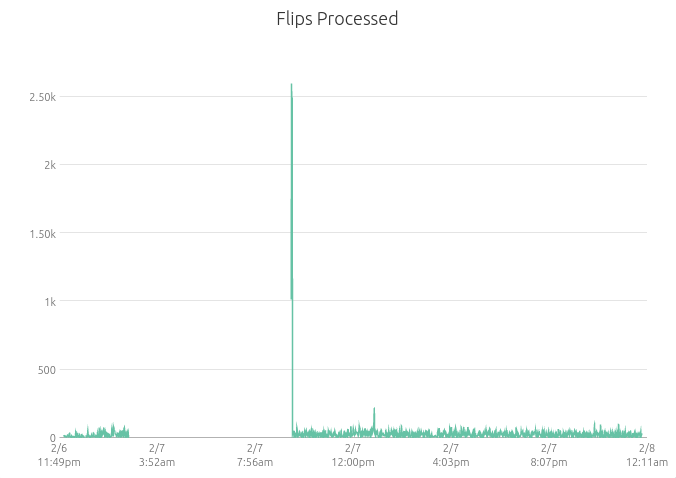
After fixing the bad cron schedule, the notification senders resumed work and quickly went through the backlog of unsent notifications:
When notification sending resumed, Healthchecks.io sent out notifications for all checks that had flipped their state once (from “up” to “down”, or from “down” to “up”) during the outage. Unfortunately, it would have missed cases where a check flips twice (for example, “up” → “down” → “up”) during the outage window. If a check went down but came right back up during the outage window, Healthchecks.io missed it and didn’t send a notification.
The Root Cause
The “sendalerts” crash loop was tripping on the following cron schedule: “0 0 31 2 *”. Or, in human words, “at midnight of every February 31st“. The notification sender was crashing while calculating the next expected ping time for this schedule.
The Fix
To get around the immediate crashing problem, I manually edited the problematic cron schedule
In the “sendalerts” management command I added a mitigation for repeatedly crashing on the exact same check. With the mitigation, “sendalerts” postpones the problematic check for 1 hour, so it can process other checks in the meantime.
I added extra validation step for cron expressions. Healthchecks now makes sure it can calculate a valid “next ping time” for a cron expression before allowing it into the system.
When the outage started, I received monitoring alerts from three different services. All three alerts went to email, and I didn’t notice them until the morning. I’ve now updated notification settings to also receive Pushover notifications with the “Emergency” priority. These notifications override phone’s Do Not Disturb settings and repeat until acknowledged.
I apologize to all Healthchecks.io users for any inconvenience caused.
How I picked the services for comparison: I searched for “cron monitoring” on Google and picked the top results in their order of appearance. I was looking specifically for hosted, SaaS-style services.
Disclaimer: I run one of the services being compared, so I’m a biased source. In particular, choosing the axis of comparison is subjective, and of course I’m inclined to choose metrics that would make my service look good. When in doubt, do your own research!
Timeout-based schedules
Cron expression schedules
/fail endpoint
/start endpoint
Pinging via email
Team Features
Projects
Teams
Notification Methods
Email
Webhooks
Slack
SMS
Price per Month
For 1 cron job
free
free
free
$10
free
free
free
For 10 cron jobs
$24
free
$49
$10
$5
$15
$19
For 20 cron jobs
$24
free
$49
$10
$20
$25
$19
For 40 cron jobs
$24
$20
$49
$10
$20
$100
$19
For 80 cron jobs
$79
$20
$99
$10
$20
$100
$19
Authentication Methods
Username and password
Google or Github
SSO (SAML2)
Company Metrics
Years in business
5
4
2
13
5
8
8
Head count
2
1
1
?
?
?
?
Popularity in Slack App Directory
4
4
8
–
–
–
5
Timeout-based Schedules
Also called “simple” monitors, where the user specifies a period (for example, one hour). The client system must “check in” at least every period, otherwise the monitoring system raises an alert.
Timeout-based schedules are supported by every reviewed service except Site24x7.
Cron Expression Schedules
The user specifies a cron expression (for example, “0/5 * * * *”) and a timezone. The monitoring system calculates expected “check in” deadlines based on the cron expression.
Supported by: Cronitor, Healthchecks.io, CronHub, Site24x7. Partially supported by: PushMon (uses non-standard syntax). Not supported by: CronAlarm, Dead Man’s Snitch.
Fail Endpoint
The ability to explicitly signal a failure. This allows quicker failure notifications, without waiting before the configured timeout and grace time runs.
Supported by: Cronitor, Healthchecks.io, Cronhub, CronAlarm, PushMon, Dead Man’s Snitch. Not supported by: Site24x7.
Start Endpoint
The ability to signal when a cron job execution starts. This enables the measurement and monitoring of the job’s run time.
Supported by: Cronitor, Healthchecks.io, Cronhub, Site24x7, CronAlarm. Partially supported by: Dead Man’s Snitch (job’s runtime is reported on completion by a wrapper script). Not supported by: PushMon.
Pinging Via Email
With this feature, clients can report their status by sending an email. This comes handy when integrating with a services that support email status reports and nothing else.
Supported by: Healthchecks.io, Dead Man’s Snitch Not supported by: Cronitor, Cronhub, Site24x7, CronAlarm, PushMon.
Projects
The ability organize monitored cron jobs and their associated information by project. Project’s don’t matter much when you have only a few cron jobs to monitor, but become increasingly important as account’s size grows.
Supported by: Healthchecks.io, Site24x7 (“monitor groups”), PushMon (tagging), Dead Man’s Snitch (“cases”). Not supported by: Cronitor, Cronhub, CronAlarm.
Teams
The ability to give your team members limited access to your account. The alternative would be to use a shared single-user account, which is of course not ideal.
Supported by: Cronitor, Healthchecks.io, Cronhub, Site24x7, Dead Man’s Snitch. Not supported by: CronAlarm, PushMon.
Notification Methods
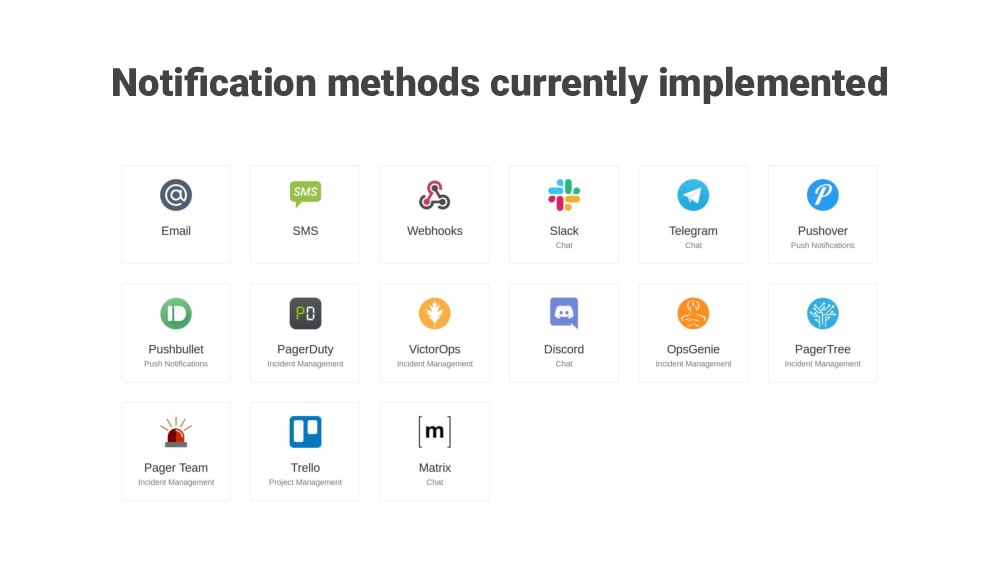
Notifications to email, Slack and custom webhooks is supported by all reviewed services. The support for other notification methods varies from service to service:
Email
Discord
Matrix
MS Teams
OpsGenie
PagerDuty
PagerTeam
PagerTree
Pushbullet
Pushover
Slack
SMS
Telegram
Trello
Twitter DM
VictorOps
Webhooks
WhatsApp
Authentication Methods
All reviewed services support classic authentication using username and password. Some of the services offer additional options:
Cronitor supports single-sign-on (SSO) using the SAML2 standard.
Healthchecks.io supports signing in via one-time sign in links to email.
Cronhub supports authentication using Github.
Site24x7, as a part of Zoho, supports a variety of single-sign-on options.
Years in Business
Site24x7 is the oldest company in the group with 13 years in business. Dead Man’s Snitch and PushMon are the second oldest, dating from 2011-2012. Cronitor, Healthchecks.io and CronAlarm were founded in 2014-2015. Cronhub is the youngest with 2 full years in business.
Head Count
Company size is a double edged sword. On one hand, larger companies seem like the safer option: they are less likely to shut down, and are more likely to have 24/7 staff monitoring their operations.
On the other hand, the smaller companies may have only a few people manning the systems, but they are passionate and committed.From my personal experience, when reporting problems to smaller companies, I’ve often had the issues fixed and a personal reply from a co-founder in hours.
The exact company size is usually not public information and I have only a few data points here:
Cronitor was started by two cofounders, August and Shane. I don’t know for sure but assume they are still a team of two.
Healthchecks.io is a one-man-band (the one man being me, Pēteris)
Slack App Directory appears to be showing the apps by their popularity, and so can be used as an indirect way to compare real-world usage of the different services. I skimmed through the Developer Tools category and noted the positions:
Healthchecks.io and Cronitor are close by in search results on page 4.
Dead Man’s Snitch is on page 5.
Cronhub is on page 8.
In Closing
If you notice any factual errors, please let me know, and I’ll get them fixed ASAP!
There are many more things to compare (Do they have an API? Which country are they based in? What has their historic uptime been like? Which one has the prettiest landing page? …), but I decided to stop here. If you are shopping for a cron monitoring service, you will have to decide what is important for you, and likely do some additional research.
One class of support requests I get at Healthchecks.io is about occasional failed HTTP requests to ping endpoints (hc-ping.com and hchk.io). Following an investigation, the conclusion often is that the failed requests are caused by a packet loss somewhere along the path from the client to the server. The problem starts and ends seemingly at random, presumably as network operators fix failing equipment or change the routing rules. This is mostly opaque to the end users on both ends: you send packets into a “black hole” and they come out at the other end – and sometimes they don’t.
One way to measure packet loss is using the mtr utility:
Puts mtr into wide report mode. When in this mode, mtr will not cut hostnames in the report.
-c 1000
The number of pings sent to determine both the machines on the network and the reliability of those machines. Each cycle lasts one second.
-s 1000
The packet size used for probing. It is in bytes, inclusive IP and ICMP headers.
-r
Report mode. mtr will run for the number of cycles specified by the -c option, and then print statistics and exit.
The last parameter is the IP address to probe. You can also put a hostname (e.g. hc-ping.com) there. The above run shows a 5.2% packet loss from the host to one of the IPv6 addresses used by Healthchecks.io ping endpoints. That’s above what I would consider “normal”, and will sometimes cause latency spikes when making HTTP requests, but the requests will still usually succeed.
Packet loss cannot be completely eliminated: there are always going to be equipment failures and human errors. Some packet loss is also allowed by IP protocol’s design: when a router or network segment is congested, it is expected to drop packets.
I’ve been experimenting with curl parameters to make it more resilient to packet loss. I learned that with enough brute force, curl can get a request through fairly reliably even at 80% packet loss levels. The extra parameters I’m testing below should not be needed, and in an ideal world the HTTP requests would just work. But sometimes they don’t.
For my testing I used iptables to simulate packet loss. For example, this incantation sets up 50% packet loss:
iptables -A INPUT -m statistic --mode random --probability 0.5 -j DROP
Be careful when adding rules like this one over SSH: you may lose access to the remote machine. If you do add the rule, you will probably want to remove it later:
iptables -D INPUT -m statistic --mode random --probability 0.5 -j DROP
I made a quick bash script to run curl in a loop and count failures:
errors=0
start=`date +%s`

for i in {1..20}
do
    echo -e "\nAttempt $i\n"
    # This is the command we are testing:
    curl --retry 3 --max-time 30 https://hc-ping.com/6e1fbf8f-c17e-4749-af44-0c81461bdd19
    if [ $? -ne 0 ]; then
        errors=$((errors+1))
    fi
done

end=`date +%s`
echo -e "\nDone! Attempts: $i, errors: $errors, ok: $(($i - $errors))"
echo -e "Total Time: $((end-start))"
For the baseline, I used the “–retry 3” and “–max-time 30” parameters: curl will retry transient errors up to 3 times, and each attempt is capped to 30 seconds. Without the 30 second limit, curl could sit for hours waiting for missing packets.
Baseline results with no packet loss:
👍 Successful requests
20
💩 Failed requests
0
⏱️ Total time
4 seconds
Baseline results with 50% packet loss:
👍 Successful requests
20
💩 Failed requests
0
⏱️ Total time
2 min 4 s
Baseline results with 80% packet loss:
👍 Successful requests
13
💩 Failed requests
7
⏱️ Total time
17 min 43 s
Next, I increased the number of retries to 20, and reduced the time-per-request to 5 seconds. The idea is to fail quickly and try again, rinse and repeat:
When using the –retry parameter, curl delays the retries using an exponential backoff algorithm: 1 second, 2 seconds, 4 seconds, 8 seconds, … This test was going to take hours so I added an explicit fixed delay:
Fast retries with 1 second retry delay and 80% packet loss:
👍 Successful requests
15
💩 Failed requests
5
⏱️ Total time
18 min 18 s
Of the 5 errors, in 3 cases curl simply ran out of retries, and in 2 cases it aborted with the “Error in the HTTP2 framing layer” error. So I tried HTTP/1.0 instead. To make the results more statistically significant, I also increased the number of runs to 100:
For a good measure, I ran the baseline version again, now with 100 iterations. Baseline results:
👍 Successful requests
75
💩 Failed requests
25
⏱️ Total time
60 min 22 s
Summary: in a simulated 80% packet loss environment, the “retry early, retry often” strategy clearly beats the default strategy. It would likely reach 100% success rate if I increased the number of retries some more.
Forcing HTTP/1.0 prevents curl from aborting prematurely when it hits the “Error in the HTTP2 framing layer” error.
Going from HTTPS to plain HTTP would likely also help a lot because of the reduced number of required round-trips per request. But trading privacy for potentially more reliability is a questionable trade-off.
From my experience, IPv6 communications over today’s internet are more prone to intermittent packet loss than IPv4. If you have the option to use either, you can pass the “-4” flag to curl and it will use IPv4. This might be a pragmatic choice in short term, but we should also keep pestering ISPs to improve their IPv6 reliability.
If you experience failed HTTP requests to Healthchecks.io, and fixing the root cause is outside of your control, adding the above retry parameters to your curl calls can help as a mitigation. Also, curl is awesome.
Office 365 has a fancy optional feature called Advanced Threat Protection (ATP). It scans incoming emails for malware. It also opens any links in the emails and scans the contents of the links as well. Unfortunately, if an email message has an “Unsubscribe” link, ATP will “click” that link too and potentially unsubscribe the user.
The standard fix is to make sure a simple HTTP GET request does not unsubscribe the user. HTTP GET requests should be “safe” and side-effect free. To achieve one-click unsubscribe, my approach used to be:
A HTTP GET request to the unsubscribe URL serves a HTML form, and a tiny bit of JS to submit the form on page load
A HTTP POST request actually unsubscribes the user
This has been working fine with most email security scanners and link preview generator bots. But Office 365 ATP is more sophisticated than others: it scans URLs found in email messages by loading them in a full-blown browser, and the browser executes JS. This defeats my simple bot protection, and insta-unsubscribes Office 365 users with ATP enabled from Healthchecks.io notifications the moment they receive the first notification.
A simple solution would be to remove the auto-submit JS code, and always require a manual click from the user to confirm the unsubscribe. But I really didn’t want to give up the single-click unsubscribe functionality, and was looking for alternate solutions. I asked on StackOverflow and got an answer with several good ideas (thanks Adam!). I implemented the “timer” idea:
If the unsubscribe link is opened less than 5 minutes after sending the email, treat it as potential bot activity, and require manual confirmation (user/bot needs to do one extra click).
Otherwise, assume it’s human and auto-submit the form on page load.
From what I’ve seen in practice, ATP scans the links as soon as it receives the email. So it doesn’t receive the auto-submit JS code, and cannot execute it. I’ve verified with an affected user that this mitigation indeed seems to be working: since deploying the fix they have received several Healthchecks.io notifications, and ATP has not auto-unsubscribed them yet. So we’re good, at least until Office 365 changes tactics.
PS. There is also RFC 8058: “Signaling One-Click Functionality for List Email Headers”. It specifies the “List-Unsubscribe-Post” email header:
This tells the email client: to unsubscribe without additional confirmation step, send HTTP POST to the URL in the “List-Unsubscribe” header. The email client can implement its own “Unsubscribe” function in its UI. For example, in Gmail you may see an “Unsubscribe” link next to sender’s address:
I’ve implemented this in Healthchecks.io, but I need an “unsubscribe” link in email’s footer too because people still look for it there.
On 27 October around 18:30 UTC one of the load balancers serving healthchecks.io, hc-ping.com and hchk.io started experiencing network issues. A monitoring script correctly detected this and removed the affected load balancer from DNS rotation, but some requests still got lost while the DNS changes propagated.
After receiving a monitoring alert I jumped in to investigate. The load balancers and backend servers are set up to communicate over a virtual private network (Hetzner’s vSwitch feature). The problematic load balancer was intermittently unable to reach the backend servers over their private IP addresses. Haproxy was reporting backends sporadically flipping between healthy / unhealthy states.
I opened a support request with Hetzner at 19:03 UTC, and in the meantime tried various things to fix the issue myself. Hetzner support confirmed they are dealing with an issue and at 22:21 UTC they reported the issue was resolved. The load balancer could reach all its peers over their vSwitch IP addresses again. I monitored connectivity for one more hour and then added the load balancer back to DNS rotation.
At the time of writing this, I don’t yet know what was the exact root cause was. The vSwitch configuration had worked with absolutely no problems for many months, and this incident came seemingly out of the blue. I requested more details from Hetzner support and so far they’ve said they are still analyzing this incident, but the vSwitch feature itself is considered “very stable”. I have not made up my mind whether to replace the vSwitch networking with something else. I don’t want to make hasty decisions, and will first wait for more information from Hetzner.
In summary, the good:
A monitoring script correctly detected a malfunctioning load balancer and removed it from DNS rotation.
Luckily I was able to investigate immediately (the incident happened on Sunday at 8:30PM local time).
Quick communication from Hetzner support: 7 updates from them in 3 hours.
And, what really matters in the end: they got the issue fixed.
The other load balancer remained fully functional the whole time. Some of the uptime monitoring services didn’t even notice an outage.
And the bad:
Some pings from client systems did get lost. This likely resulted in a number of false “X is down” alerts after the outage.
I apologize to all Healthchecks.io users for any inconvenience caused. For a monitoring service, any downtime is unacceptable, and I will continue to look for any opportunities to make the service more robust.
For a monitoring service, uptime and reliability is of course a critical feature: customers are placing trust in the service to detect problems and deliver timely and accurate alerts. While I cannot guarantee that Healthchecks.io will absolutely never let you down, I can offer transparency on how it is currently being hosted and operated.
I will use bullet point lists liberally in this blog post (otherwise, it could turn into “The Opinionated and Frugal SRE Book”). Let’s go:
Main values: Simple is good. Efficient is good. Less is more.
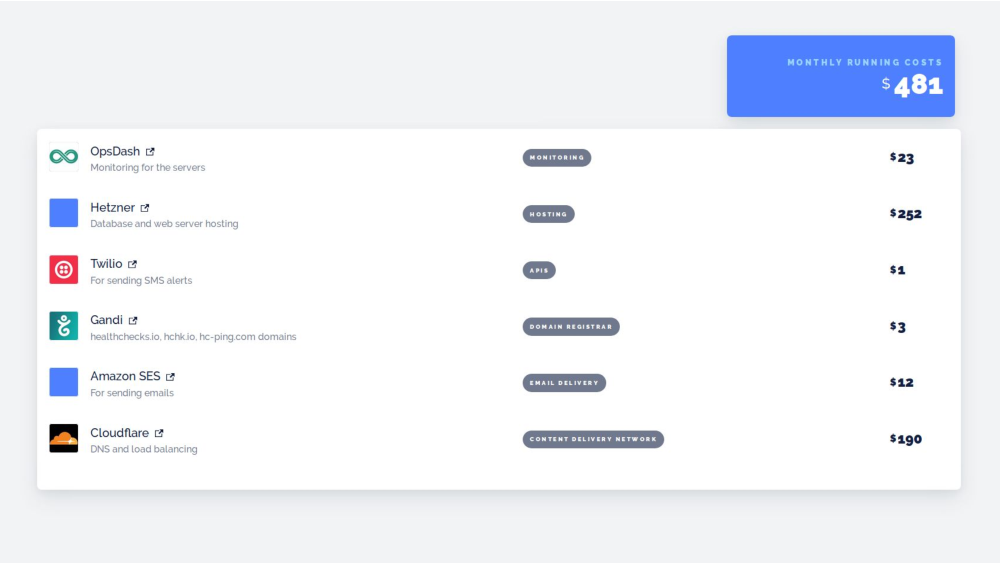
The core infrastructure runs on Hetzner bare metal machines. Hetzner offers amazing value for money and is a big part of the reason why Healthchecks.io can offer its current pricing.
No containers, no auto-scaling, no “serverless”. Plain old servers, each dedicated to a single role: “load balancer”, “application server” and “database server”.
The machines are closer to “pets” than “cattle”: I have provisioning scripts to set up new ones relatively quickly, but in practice the working set of machines changes rarely. For example, the primary database server currently has an uptime of 375 days.
Load balancers
Hardware: Two Intel 9900K machines, costing €69/month each.
Software: HAProxy.
Fault tolerance: A watchdog script on an external VM, detects unhealthy load balancers and removes their DNS records.
Supports HTTP/2. Supports IPv6. Uses ECDSA certificates with modern clients and falls back to RSA certificates with old clients.
Used Loader.io to test performance-related configuration changes.
Before going HAProxy, I used Cloudflare Load Balancer. Compared to Cloudflare,
The monthly running cost ends up being slightly lower but similar.
It took more work to research, set up, and maintain the dedicated load balancer servers.
HTTP request latencies seen from clients are much more consistent. Cloudflare was great on some days, and not so great on others.
More control over the load balancer configuration, and more options to diagnose problems.
Application Servers
Hardware: Three Intel 6700/7700 machines, costing €39/month each.
Software: Nginx -> uWSGI -> Django.
Fault tolerance: load balancers detect unhealthy or “in maintenance mode” machines and remove them from rotation.
For daemon processes that need to be constantly running (“sendalerts”, “sendreports”) I use systemd services.
Communication with load balancers is over private network (Hetzner’s vSwitch).
Side note: when I started out, I took the private network idea to the extreme: I asked Hetzner support to install two NICs in each machine, and to connect the secondary NICs using a dedicated switch. A custom order like that takes more time (days instead of minutes) and costs more, but is possible. I later moved away from that setup, for a couple of reasons:
All servers had to be in the same rack. Cannot add more machines if the rack is full.
Also, with this setup, one critical switch failure could take out all of the servers.
Fault tolerance: I am not brave enough to completely automate database failover – I have a tested procedure to perform the failover, but the decision has to be made manually.
Application servers specify multiple hosts in the database connection strings. When primary changes, the applications can fail over to the new primary without any additional configuration changes.
Backups: Full daily backups encrypted with GPG and uploaded to S3. I keep 2 months worth of backups and delete older ones.
Monitoring
OpsDash agent and hosted dashboard for a “big picture” view of the servers, and alerting.
Netdata agent on each machine for investigating specific issues.
Four VMs in different locations sending regular pings, and logging everything, including TCP packet captures.
Logs from the VMs aggregated to Papertrail. Papertrail sends alerts on specific log events.
An always-on laptop dedicated to showing live Papertrail logs.
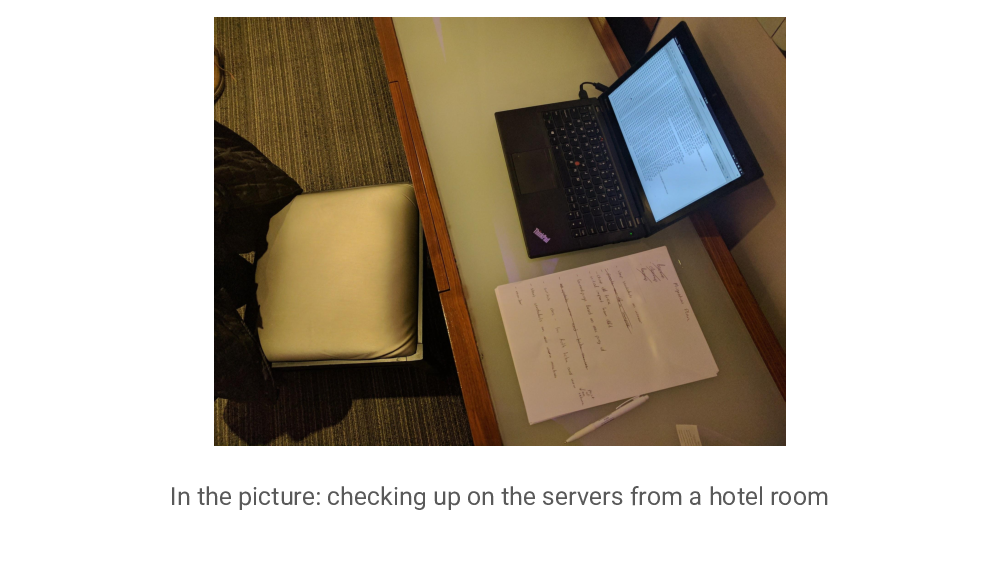
My workplace, Papertrail logs in the top right screen
Ops
Yubikey for signing commits, logging into servers and decrypting database backups. For initial setup, I used DrDuh’s guide.
A small laptop with development and deployment environments, and another Yubikey. Travels with me when I leave home.
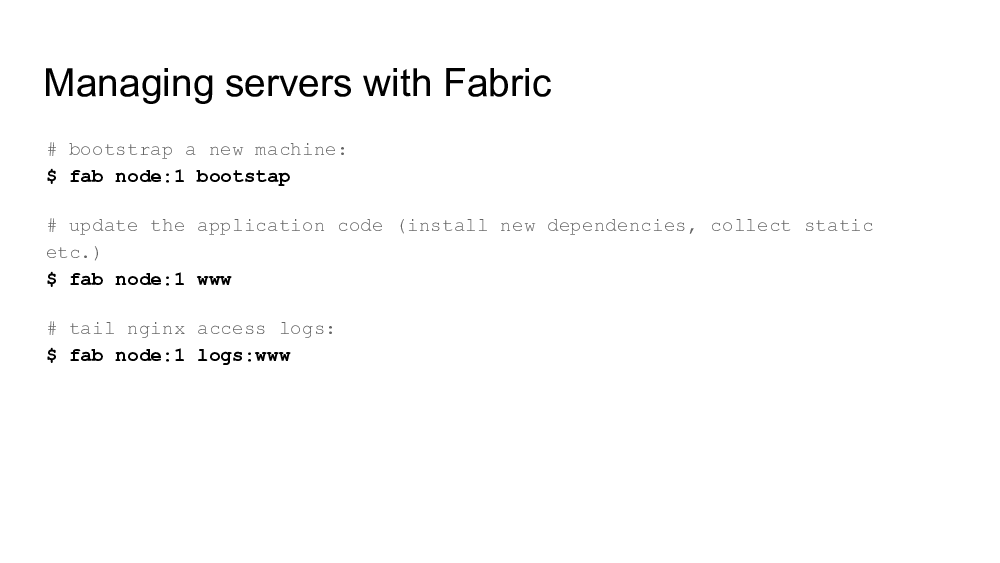
Fabric scripts for server provisioning, updates and maintenance.
Operated by one person. I’m not in front of my PC 100% of the time, so incidents can take time to fix.
Custom Bits
I maintain a private branch of the Healthchecks project with non-public customizations: branding, customized footer template, the “About”, “FAQ”, “Privacy Policy” pages and similar.
For serving the ping endpoints (hc-ping.com, hchk.io) efficiently, I wrote a small Go application, which I have not open sourced.
Last but not least, I am eating my own dog food and am monitoring many of the periodic and maintenance tasks using Healthchecks.io itself. For example, if the load balancer watchdog silently fails, I might not notice until much later when it fails to do its duty. With Healthchecks.io monitoring, if the watchdog runs into issues (the script crashes, VM loses network connectivity, anything) I receive an email and an SMS alert within minutes.
Foreword: In May this year, I had the honour to speak at PyCon Lithuania about Healthchecks. Having practically no public speaking experience, I prepared carefully. As a part of the preparation, I had the whole speech written out. This saved me from lots of awkwardness during the talk, but also makes it easy to share the final version here in a readable form. Below are the slides and the spoken text from my talk “Building an Open-source Django Side-project Into a Business” at PyCon Lithuania 2019. Enjoy!
Hello, my name is Pēteris Caune, I am happy to be here at PyconLT and this talk is about my side-project – written in Python – it’s called Healthchecks.
I will talk about my motivation for building Healthchecks, and about some of the notable events and challenges, about the project’s current state, how things have worked out so far, and future plans.
Before we get into it, here’s the current status of the project. Healthchecks is almost 4 years old. It has a bunch of paying customers and it comfortably covers its running costs. But – it is not yet paying for my time. Basically, currently Healthchecks is a side project, and the medium term plan is for it to become a lifestyle business. Keep this in mind as a context – with this project, I’m not focusing on profitability and am fine with it growing slowly. For instance, I’m not using aggressive marketing and aggressive pricing. If in your project you do need to be as profitable as possible, as soon as possible, you will want to do a few things differently than me.
So, with that in mind, let’s go!
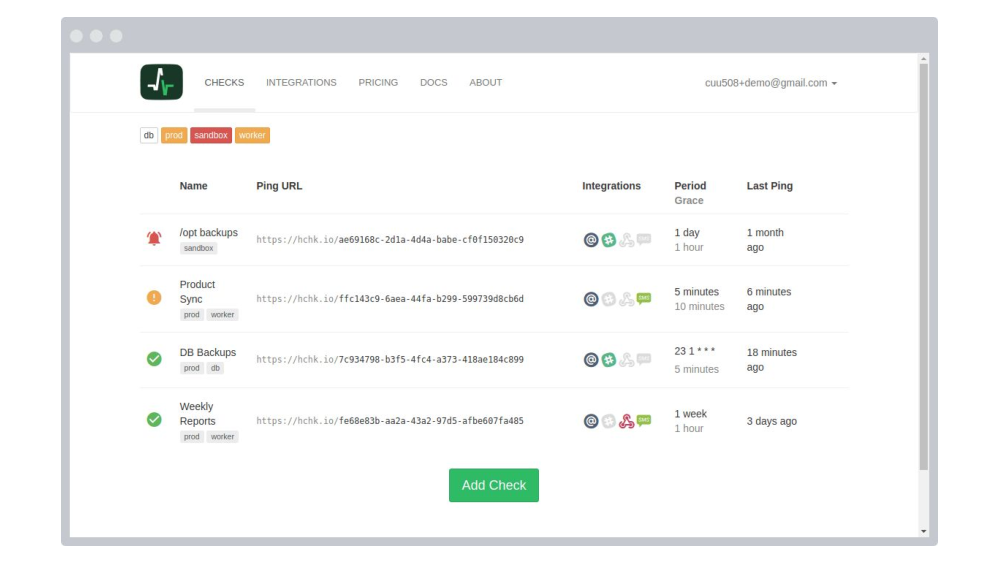
Healthchecks is a Django app for monitoring cron jobs on servers. It uses the Dead Man’s hand principle: you set up your cron job or background service to make small, simple HTTP requests to the Healthchecks server.
Each HTTP request is like a message saying “I’m still alive!”, it is a sort of a heartbeat.
The Healthchecks server looks for these “heartbeat” messages.
And it sends you alerts when they don’t arrive at the expected time. That’s the basic idea. And it’s a simple idea and I was not the first one to think of it.
About four years ago, in 2015 I was looking for a tool like this. And I found two services, that already existed, DeadMansSnitch and, recently launched, Cronitor.
They looked good, but they seemed pricey, and I could not justify paying for them for the types of things I wanted to monitor at the time.
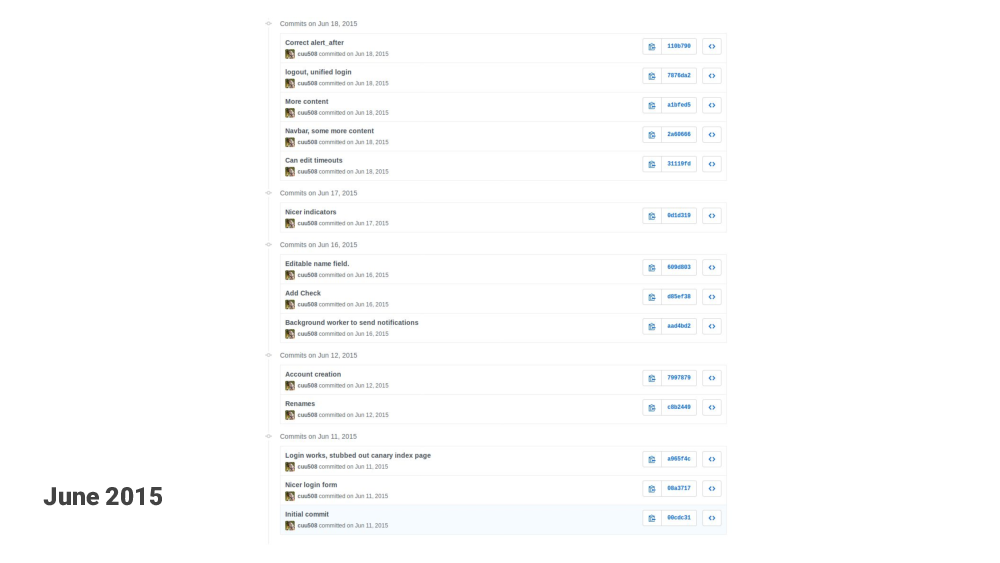
So I was bouncing around this idea for a while – “maybe I just build this myself…?” In June 2015 I started to hack on it and made the first git commits. It seemed like a fun thing to work on. I liked how conceptually simple the basic idea was.
I set a slightly ambitious goal to build a service that works as well or better than the existing services, and is offered for free or for significantly cheaper. This was the challenge: I was not interested in just cloning Dead Mans Snitch or Cronitor, and having similar pricing, and just competing with them.
Another aspect of motivation for this was: In my day job as a full stack developer I do have certain amount of influence on the various decisions. But, ultimately, I’m working on somebody else’s product. And I must be careful not to get emotionally attached to my work and its fate.
Now, with Healthchecks, I would have full control over what this thing becomes. And I would be in charge of everything: product design, UI design, marketing activities or lack thereof, customer support – talking with customers directly, taxes and legal stuff. These are the types of things that I don’t normally do as a developer.
So this would require me to get out of the comfort zone, face new challenges and learn new skills, which is good. By the way, me talking here at PyconLT is also a form of such a challenge: public speaking! I’m an introverted person – so, ya – this is a challenge!
Another line of thought was – even if the project doesn’t go anywhere, it would look good on my CV, and be useful that way.
So, that’s the motivation.
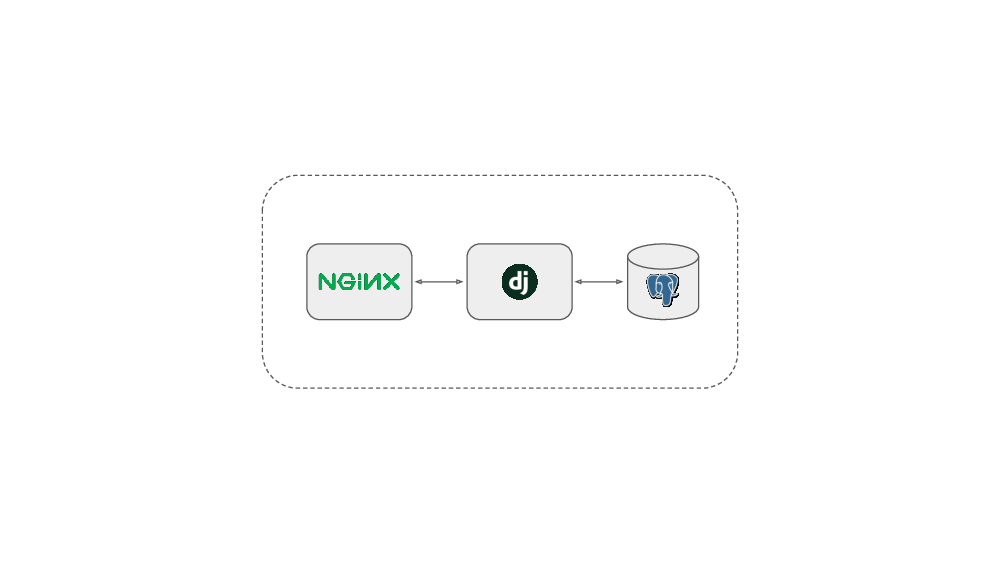
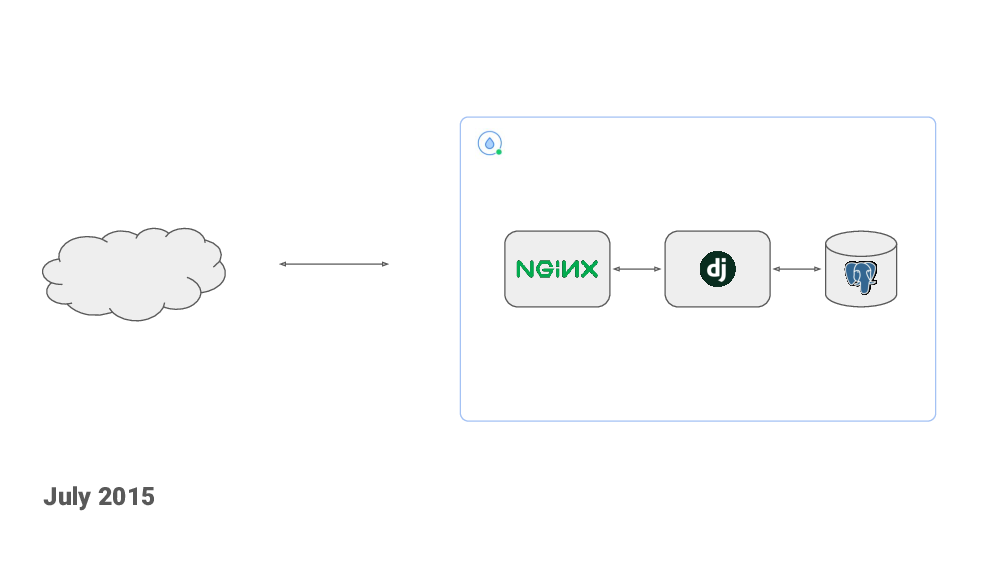
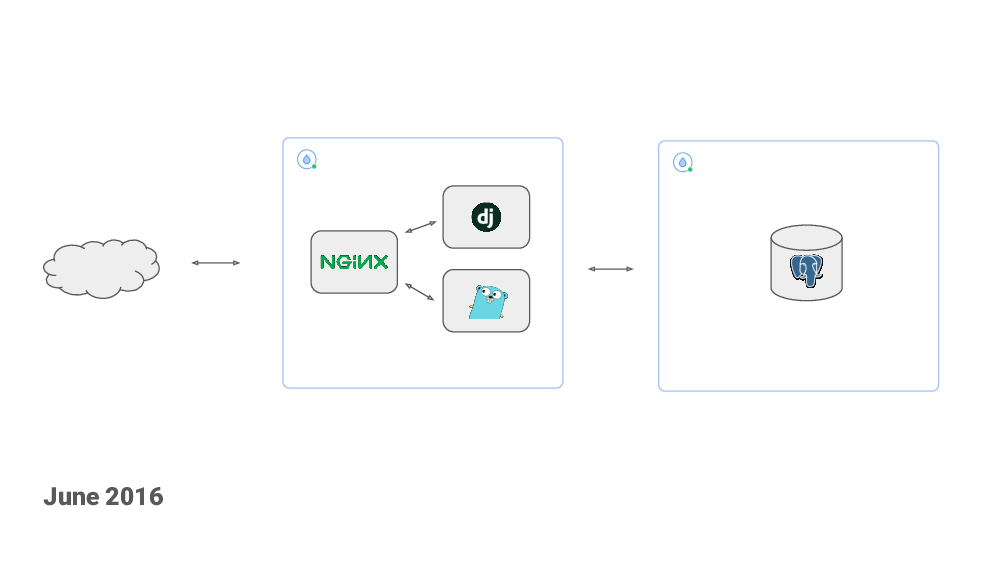
Healthchecks uses Django framework. I chose Django because I was already familiar with it. I knew I would be immediately productive. I started with a simple setup: a Django web application and a Postgres database and almost nothing more. My plan was to try to keep it as simple as possible and see how far I could get without complicating it with additional components. I set out to get the basic functionality working, then work on polishing the UI and, basically, see where it goes.
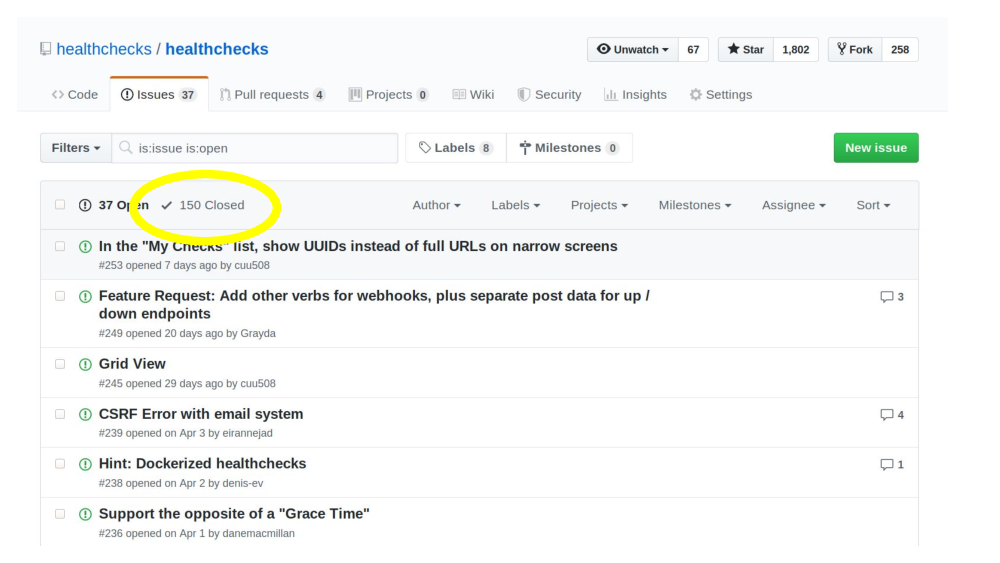
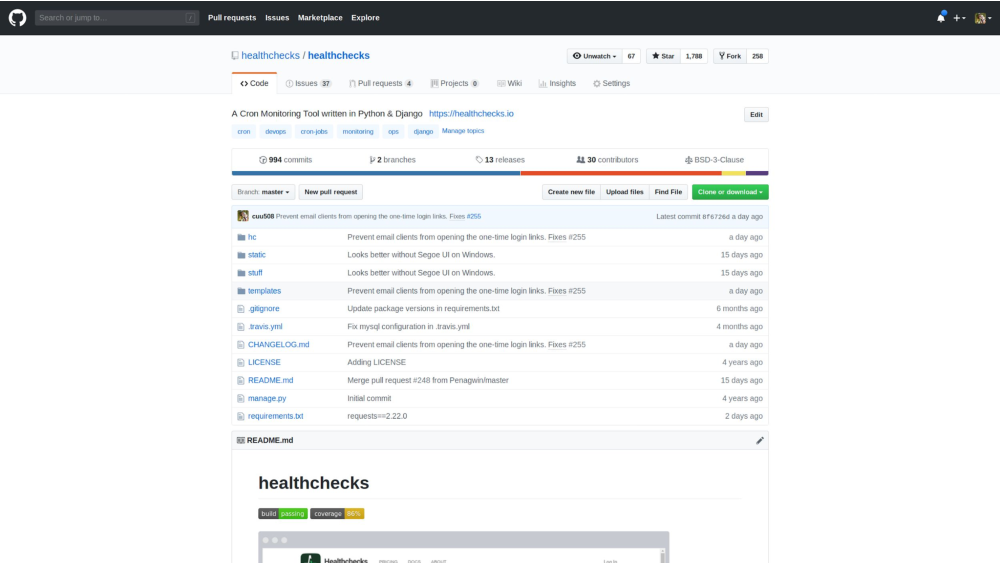
So, June 2015, I made the first commit to a public Github repository. I decided to make this open source to differentiate from existing competitors. Also, developing this in the open would be a little bit like a reality show – everyone can see how my work is progressing, and how crappy or not crappy my code is. Sounds fun, right?
A month later I deployed the code to a $5/mo DigitalOcean droplet, I bought the healthchecks.io domain and an SSL certificate. I made a “Show Hacker News” post (which did not go anywhere). And, like that, the project was live!
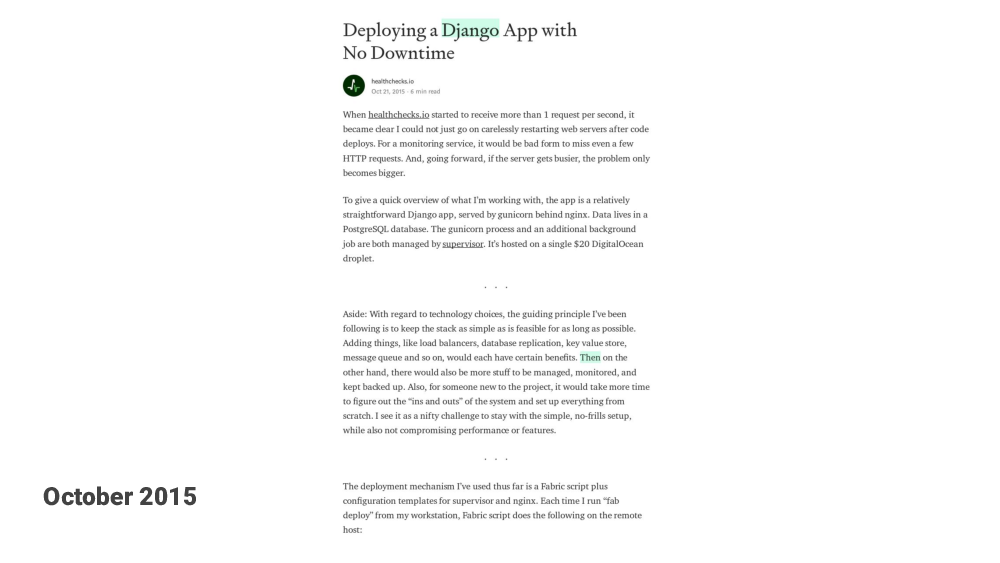
Later in 2015, I made a blog article about some technical aspects of the project, and submited it to Hacker News, of course, and this one did get on the front page and brought in a good amount of visitors. Both the webapp and the database was still on a single DigitalOcean droplet, but I had moved it up to a $20/mo in anticipation of traffic.
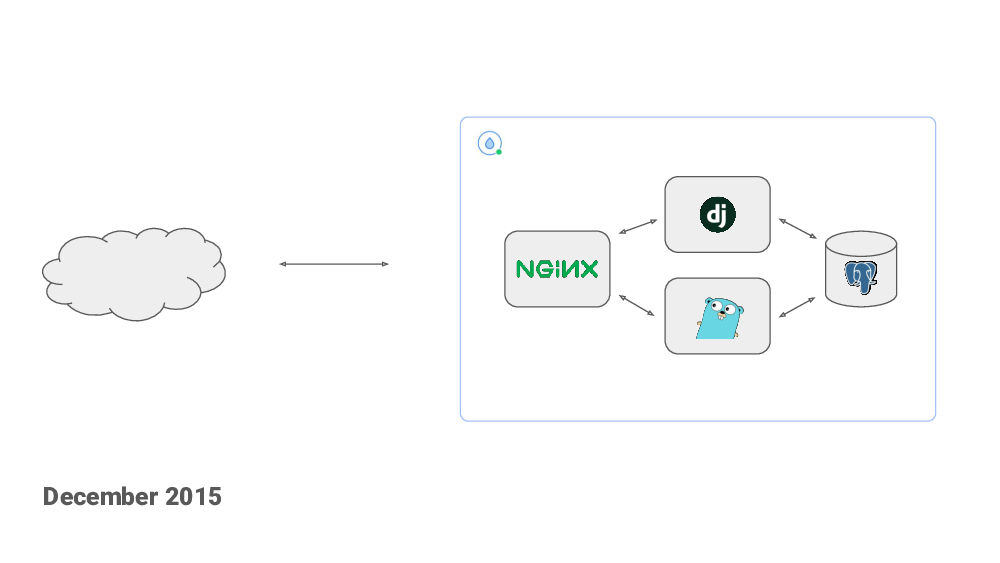
Six months in, I started to see server’s CPU usage climbing. CPU was mostly being spent handling the pings – the incoming HTTP requests sent from the cron jobs. These are simple requests but the volume was steadily going up. I used this as an excuse to learn a little bit of go-the-language and I wrote the ping handler in Go. It had a significantly smaller per-request overhead compared to Django.
My naive go code was responsible for several outages later down the road. It’s not the fault of the language of course, it’s just me not thinking about various failure scenarios, and performance degradation scenarios, and me not properly testing them.
Around the same time I was also setting up paid plans. At the launch there was only an unlimited free plan, but I needed to generate revenue, in order to at least pay for the servers. Otherwise, the project would not be sustainable long term.
First of all, I was and still am working as a contractor. Since I need to pay my taxes, I already had a registered company before diving into Healthchecks. This was fortunate because it was one less barrier for me to start the project. Taxes for the company are handled by outsourced accountants, which has been very helpful. I’m fine with paying taxes, but all the paperwork and burreaucracy I do not enjoy at all, so I try to avoid all of that as much as possible.
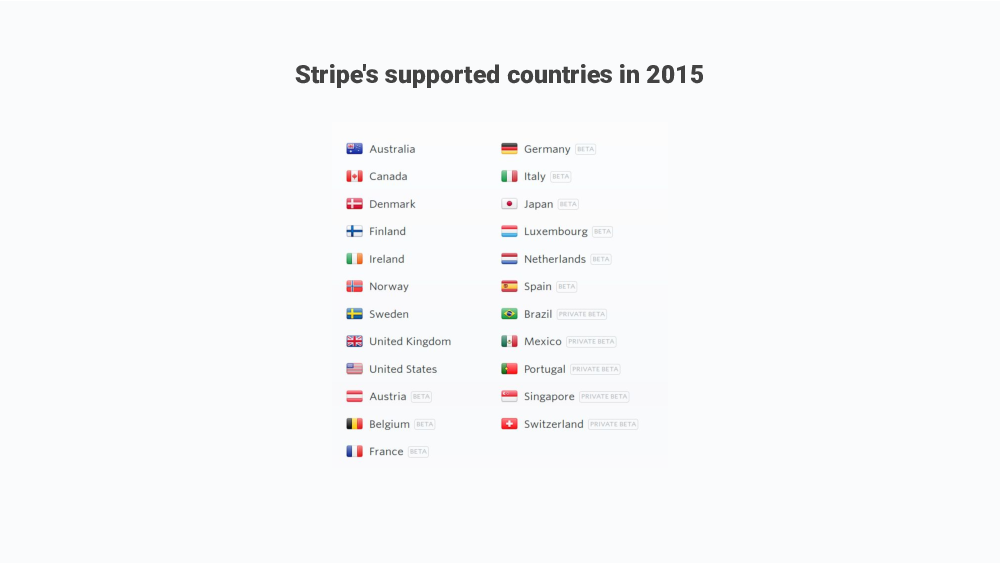
So, for payments, I looked at Stripe but it was not available in Latvia at the time.
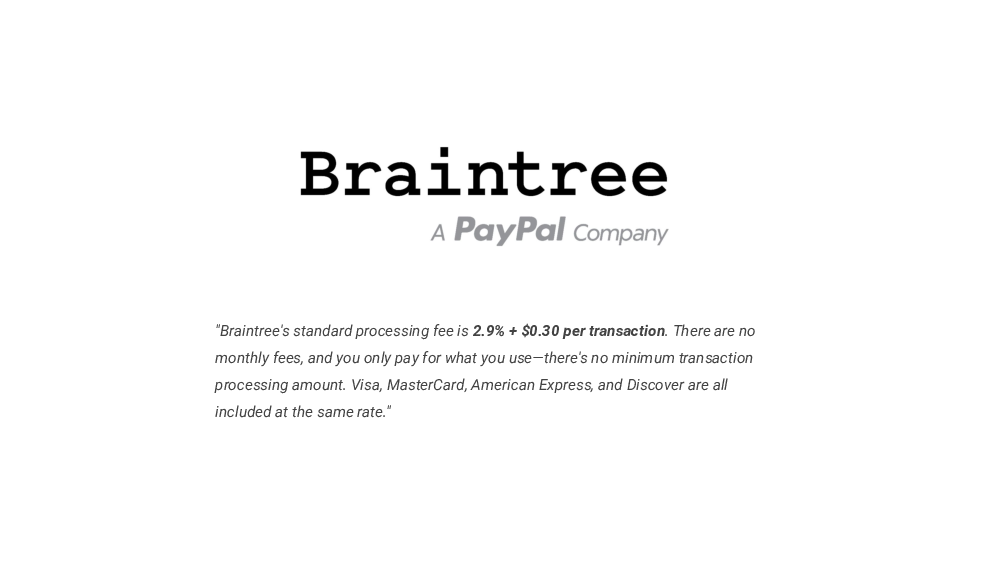
I then looked at Braintree which seemed OK. Setting up an account with them was easy enough. There was a fair bit of development work on the Healthchecks side, to integrate with their API and to build out the functionality for entering a payment method, entering billing details, selecting a plan, generating invoices.
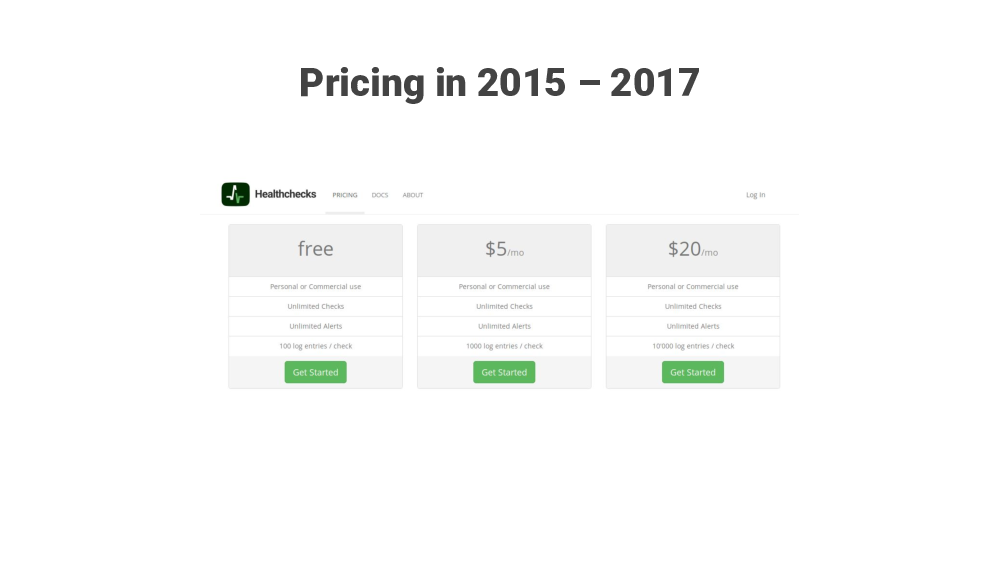
Initially, the price for the paid plan was $5/mo. The free plan was still practically unlimited, meaning there was little incentive to upgrade.
Nine months in Healthchecks got its first paying customer! $5 MRR.
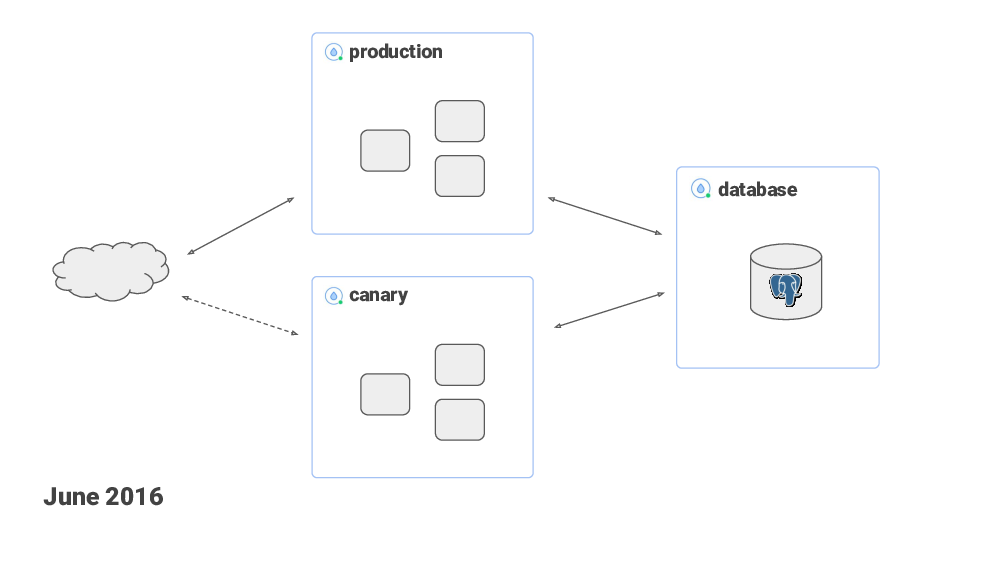
One year after starting the project, I moved from a single server setup to the web server and the database hosted on separate DigitalOcean droplets.
The web server used a floating IP. When I needed to deploy new code, I would create a new droplet, deploy the new code to it, do some smoke testing and if everything looked OK – switch the floating IP over to the new droplet. And I kept the old droplet around for a while so I could switch back in case of problems.
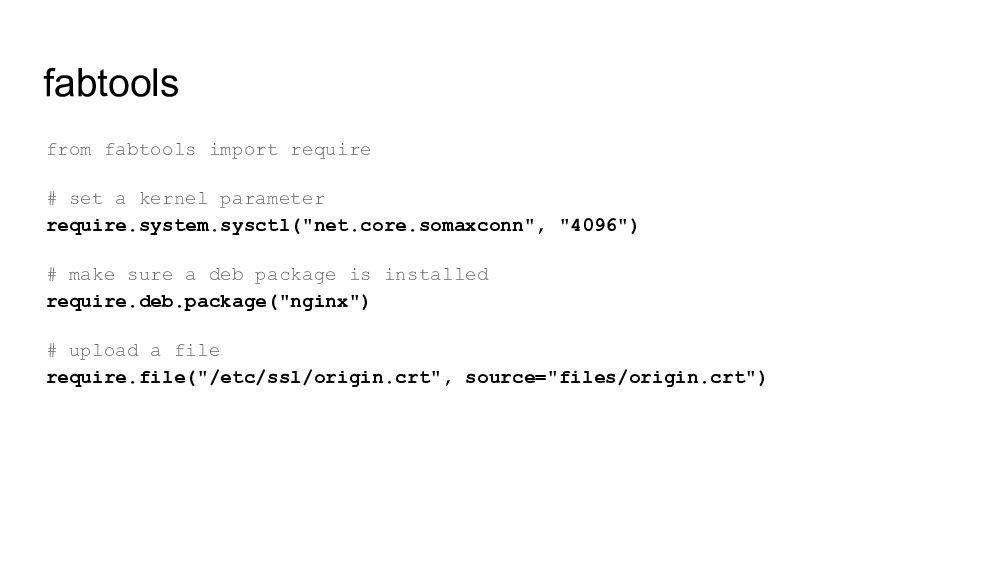
For deployment I used – and still use – Fabric with fabtools. I looked into Ansible as well, and used it for a while, but ultimately went back to Fabric because it’s less complex, less magic, is easier to reason about, and the deployments ran much faster.
I’m still using Fabric version 1.something, which uses Python 2.7. Not ideal. So I will need to deal with this in not too distant future, but it works fine for now.
August 2016, Healthchecks had an about 24 hour outage. I was away on a road trip to Estonia, I was not checking phone, and was completely unaware of the outage. When I returned home, my inbox was full emails, twitter was full of notifications and there was panic going on in github issues.
After this incident I did a few things, one was to get a dedicated second hand laptop with a working battery, and set up a development environment on it. It has a full disk encryption. It has a yubikey nano plugged in, for signing git commits and for SSH-ing into servers. It now comes with me wherever I go so I can fix issues when I’m away from home.
In 2017 I moved project’s hosting multiple times, as I was trying to improve the reliability, quality and fault tolerance of the service.
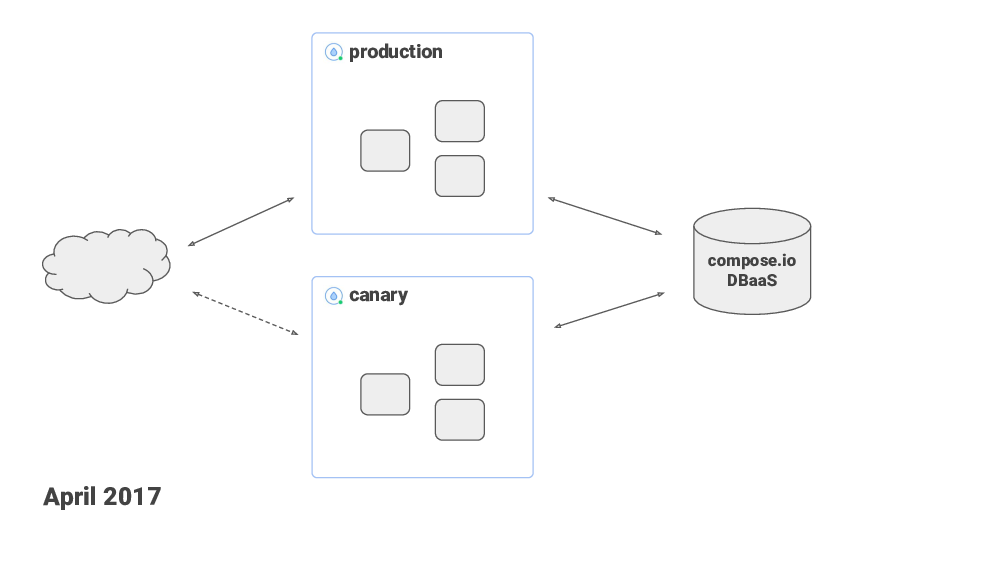
In April, I moved the Postgres database to compose.io, which is a DBaaS provider. The idea was that Compose.io would take care of managing database replication and automatic failover. It sounded good on paper and everything looked good in my preliminary testing, but, once I switched the production traffic to Compose, I was having capacity issues. In Compose you can scale up your database capacity – and your monthly bill – by simply moving sliders in their UI. I had to scale up to a point where it would be too expensive for me. So… Same month, I moved back to my previous setup.
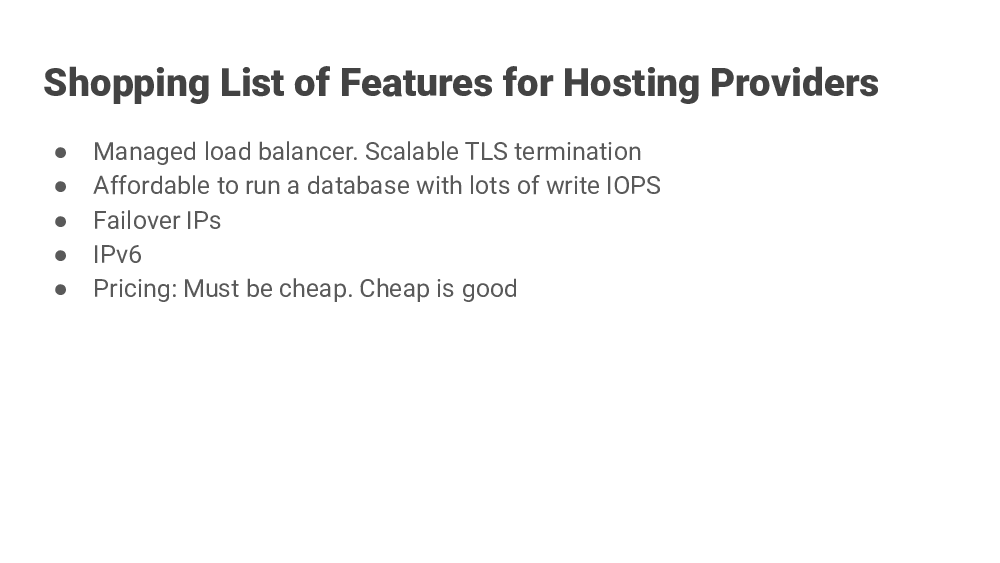
By then, I had a clear idea of what I’m looking for in a hosting provider. One of the crucial things was a load balancer that could handle traffic spikes and do lots of TLS handshakes per second. If a load balancer can nominally do, say, 200 new HTTPS connections per second, but the site sees 1000 during traffic spikes then that’s no good. And the nature of cron jobs with common schedules is that traffic does come in waves.
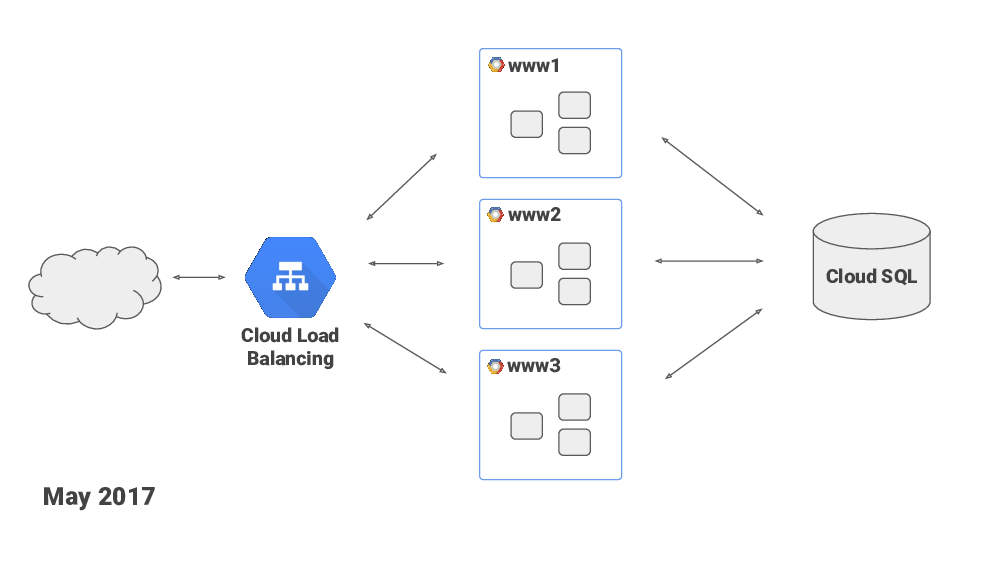
Google’s Cloud Load Balancer looked like a good option – it is, you know – Google scale! In May 2017 I moved the service to Google Cloud Platform. They had also recently launched managed Cloud Database service, which was nice, and I made use of that as well.
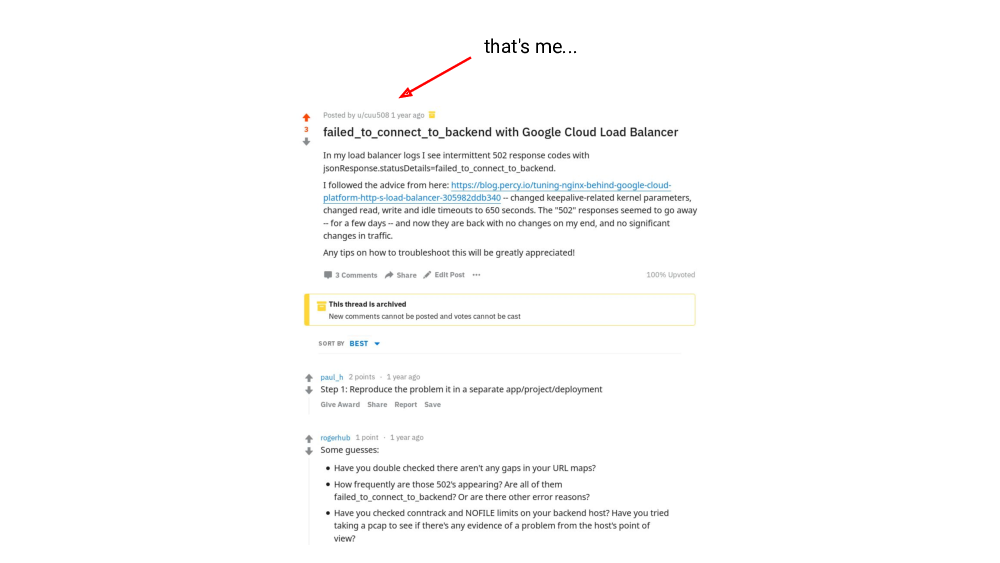
Google’s load balancer was handling any amount of TLS handshakes fine, but I was seeing occassional failed requests in the load balancer’s logs. And I spent good amount of time searching for solutions and troubleshooting – I was trying everything I could think of on my end, things like tweaking nginx parameters, I was also tweaking network-related kernel’s parameters. I opened issues with Google Cloud Platform’s customer support – they were very polite and willing to help, but didn’t seem to have the expertise or the access to engineers with the expertise.
They did suggest a few trivial things I had already tried. They found a relevant reddit post and sent me a link to it. Funny thing is, that post was written by me, I was documenting my issue and asking for advice there.
In short, I was unable to fix the issue with the failed requests, and I was looking for other options.
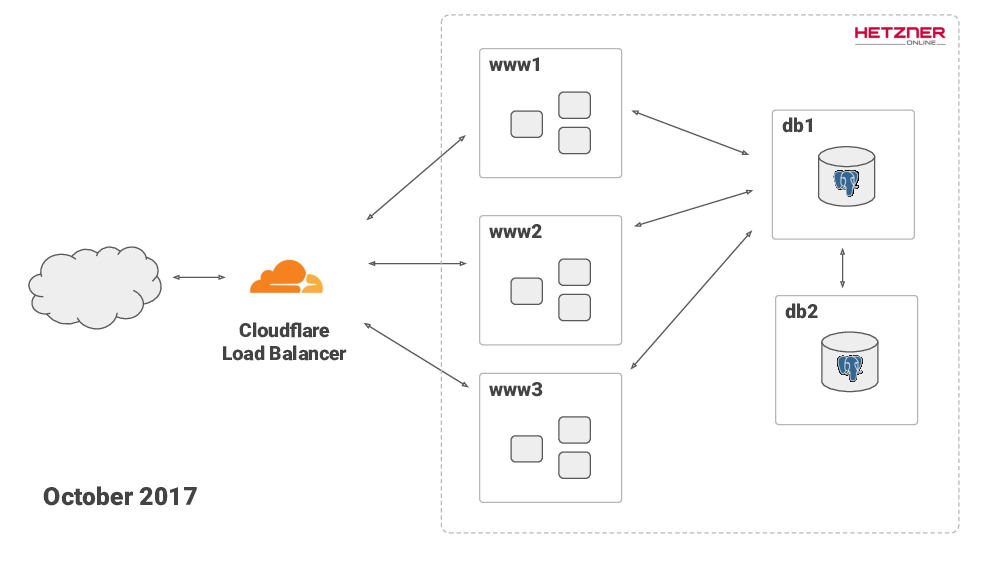
In October I moved to Hetzner for hosting, and to Cloudflare for load balancing. This is how the service is running today, I’m still using Hetzner and Cloudflare. By the way, Hetzner is a German hosting provider that has really good prices for bare metal servers.
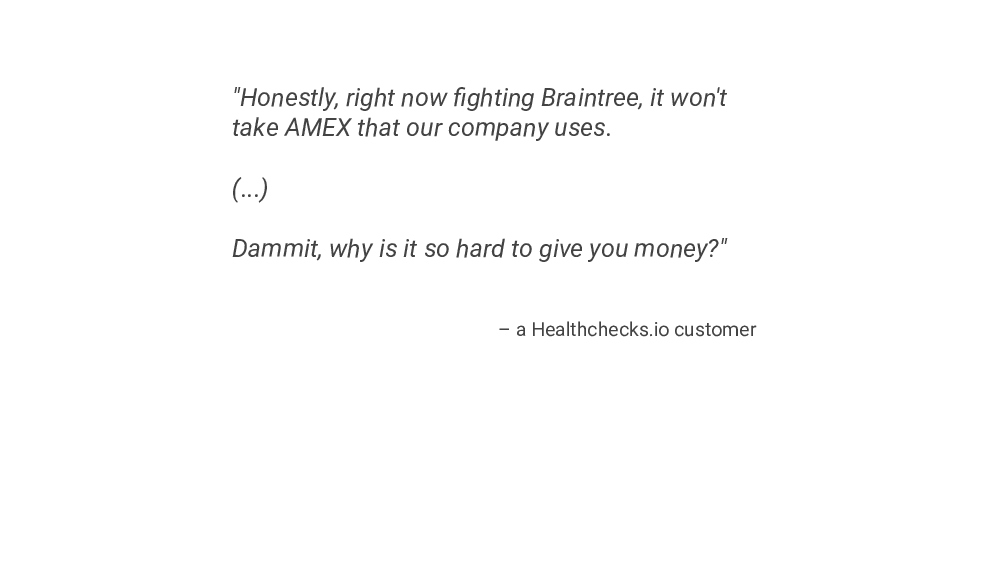
OK, so I’ve been rehearsing this talk in the past week and this was the phrasing that was suggested by my brother: “I had an interesting problem – people wanted to pay me”.
So yeah, I needed to set up American Express payment processing in Braintree. The setup involved filling a few scary looking forms, printing and signing a contract with American Express, then scanning it and sending it back to them. In hindight, it wasn’t too hard. But the feeling at the time was, – “oh this is getting serious!”
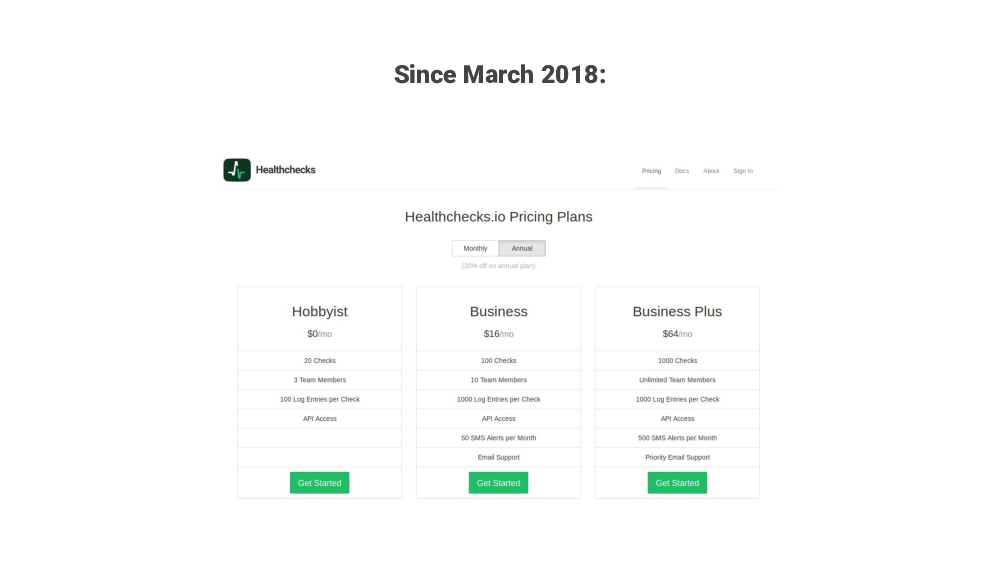
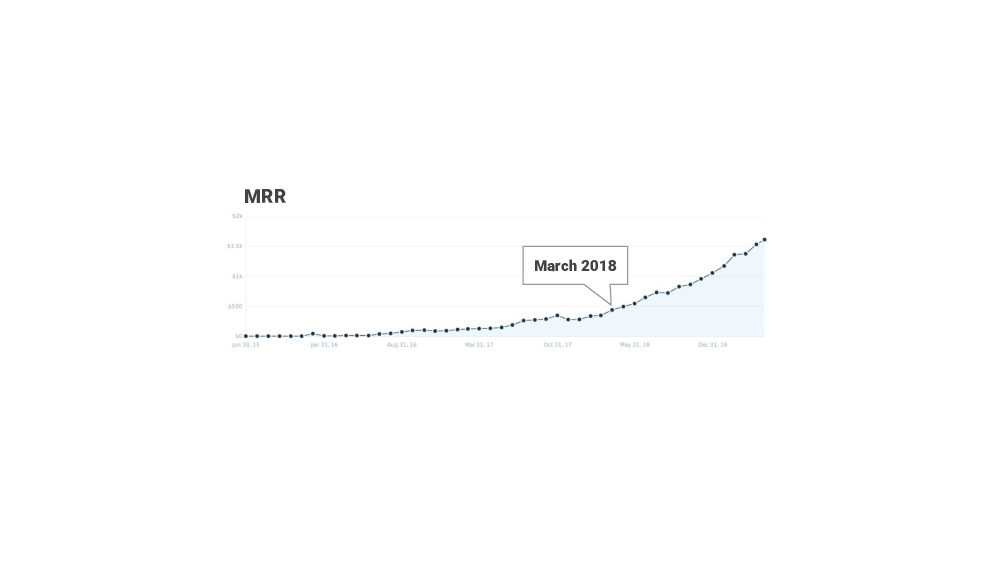
In March 2018 I increased the paid plan’s price from $5 to $20 and tightened the free plan’s limits. I decided to do this after watching and reading a bunch of Patrick McKenzie’s talks, and his podcasts and blog posts that all had one main theme: “charge more!”.
I didn’t feel this was betraying the project’s original mission. After the change, Healthchecks still had the free plan with generous limits. The free plan would be aimed at individual users and maybe small teams with no budget. But for the paid plan, which was aimed at companies, $5 or $20 should not make a difference I thought.
And, after the pricing change I didn’t get any negative feedback, which was nice, I was still seeing new signups, and the monthly recurring revenue graph started to look a bit more promising.
Last year around this time everyone was busy implementing the changes needed for GDPR compliance. And so was I. Luckily for me, the service was already in mostly good shape technically. It was not using any analytics services, so no cookie worries, it was not collecting unneeded personal data. Well, it does need to collect email addresses for sending notifications, and the users can specify mobile numbers for receiving text notifications, and, for the paid users, if they need proper invoices, then they have to enter their billing information of course. But that’s about it. I also needed to update the Privacy Notice document, like most everyone else.
In parallel to these events – chasing down network reliability issues and changing hosting providers, I’ve of course also been working on adding new features and improving the existing features based on user feedback.
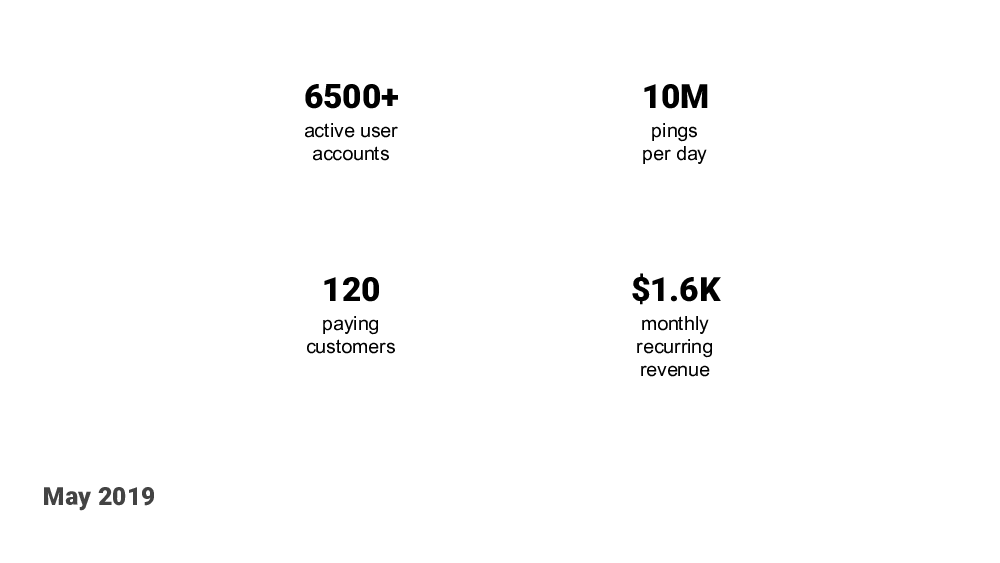
Now we are in May 2019, and here are some quick stats about the project. Healthchecks has over 6500 active user accounts, it is processing about 10M pings per day. That works out to a little over 100 pings per second. So – not too crazy but keep in mind the traffic is spikey. Healthchecks.io currently has about 120 paying customers, and he monthly revenue is $1600. A chunk of that goes back into running costs, and in taxes, overheads and what not.
Healthchecks is still running on Hetzner’s bare metal servers. The Postgres database has a primary and a hot standby, and the failover is manual. I can trigger the failover with a single command, but, yes, that command is manual. I simply don’t trust myself to anticipate all the corner cases for doing this automatically. I’ve seen dedicated teams of people smarter than me mess this up, so I’m accepting that, for time being, the failover is manual.
At a high level, the app is still simple like it was in the beginning: a few load balanced web servers running the Django app and a Postgres database (and the ping handler written in go). There are no queues, no key value stores, no fancy distributed stuff – because as long as I can get away without using them, I want to keep things simple. That’s the theme here: simple and cheap.
The Django app is still open source, and I know it is being self-hosted by more than a few people. I think open sourcing it was the right decision. I’m getting code contributions and bugfixes from time to time – mostly minor stuff but still very much appreciated.
So here’s something to think about: does the self-hosting option hurt my sales? I cannot say for sure but I estimate that, if yes, then – not by much. I think the self-hosting crowd falls into two groups: homelab enthusiasts who want to run stuff themselves for the fun of it, and companies who want to self-host because of custom needs or policy and compliance reasons. Neither group would be likely to be on a paid plan on the hosted version. So no big loss there.
Another question would be: if I look back at my “mission statement”, did I succeed? The service has lots of happy customers. Pretty much every support request starts with a “thank you for the great service”. I have also been sneakily using Slack App Directory to compare the popularity of Healthchecks and its competitors. And, at least according to this metric, Healthchecks is the most used one. So that’s good. But the big caveat is, Healthchecks is not yet paying for my time. I cannot yet afford to work on it full time. It is growing steadily though. An, luckily, I am in a fortunate position where I can afford to let it grow steadily and slowly.
Also, it has taught me a lot. It is a great addition to my CV.
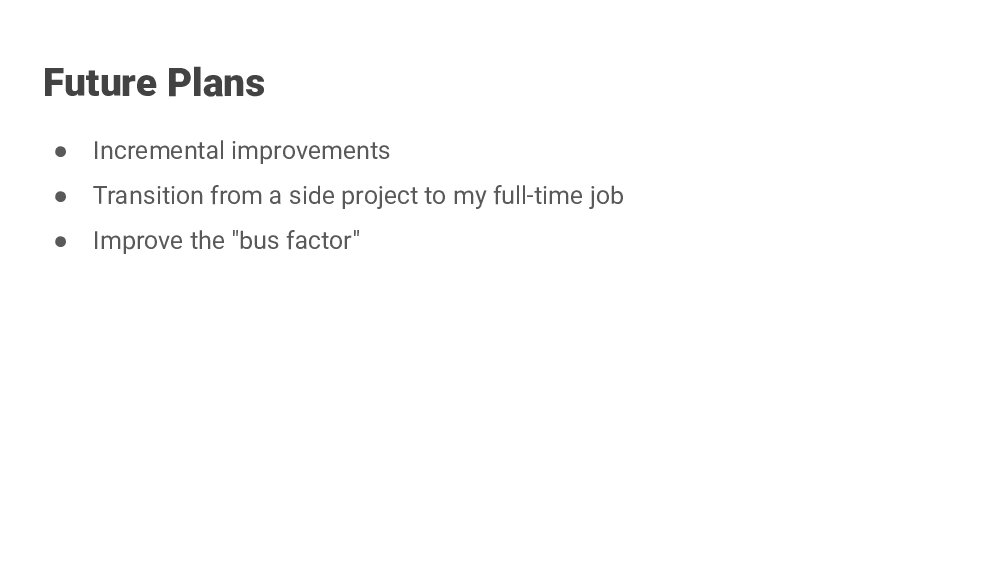
My future plans are to keep making continuous improvements to the codebase based on user feedback. Continue the work on reliability and robustness improvements. Reach a point where it pays for my time and is not a hobby project any more, whenever that happens. After that, reach a point where it pays for a second person, so it does not rely on me alone.
Working on Healthchecks.io has has been great experience. I still enjoy working on it and I look forward to do more of it. This is my talk, thanks for listening!
The primary intended use, in the case of Healthchecks.io, is to monitor the regularly running tasks on servers, such as cron jobs. However, the “alert me if X doesn’t happen on time” functionality can be useful in many other contexts too. One of the quirkier ways I’ve been personally using Healthchecks.io is to help my progress towards the Sojourner medal in Ingress.
Ingress is a location-based, augmented-reality game. It is a predecessor of Pokemon GO, and is made by the same company. In Ingress, players visit physical points of interest (“portals”) and perform various in-game actions on them. One of the gamification features in Ingress is Medals. Medals are awarded to players as they reach set milestones. For example, the “Trekker” medal is awarded for walking a long distance while playing Ingress:
Bronze: 10 km, Silver: 100 km, Gold: 300 km, Platinum: 1000 km, Black: 2500 km
Another medal in Ingress is Sojourner. For the Sojourner medal, the player must visit and “hack” portals in consecutive 24 hour periods:
The black Sojourner medal is notoriously hard to obtain. If the player misses their 24 hour window, the current hacking streak resets to zero, and they have to start from scratch. The player must keep track of “When was my last hack? How much time do I have left?” day in day out. My own highest hacking streak is 233 days. Everything was going well until one day I forgot to go outside and do my “daily hack” on time. And just like that, I was back to square one!
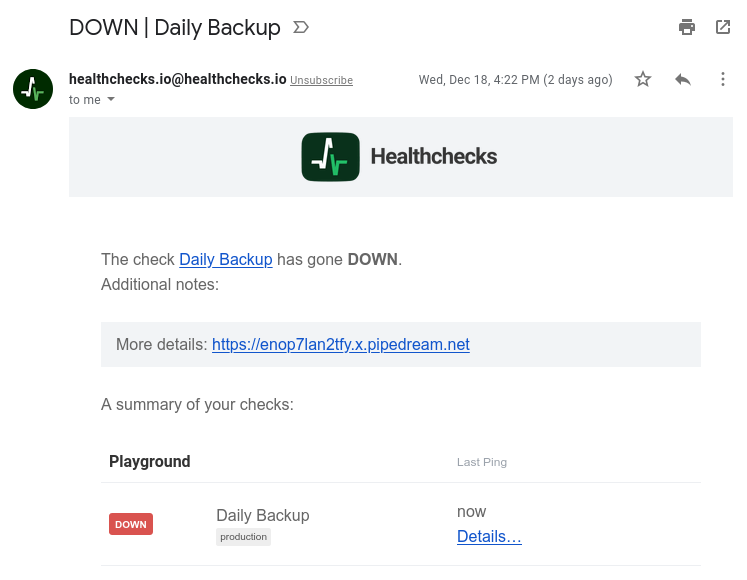
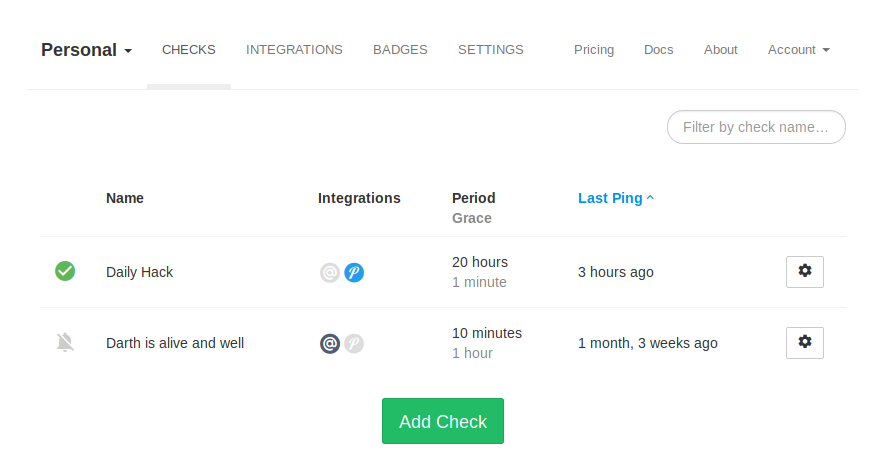
After a period of “I’m never doing this again!”, I started another attempt. This time I was also using Healthchecks.io to keep track of how much time I have left each day and to remind me when the time is about to run out. Here’s how this works: I’ve set up a check on Healthchecks.io with a period of 20 hours:
For notifications, I’m using Pushover with the “emergency” priority: if the “Daily Hack” check doesn’t get pinged at least every 20 hours, my phone will get a notification. The “emergency” priority causes the notification to be repeated every 5 minutes until it is acknowledged. The emergency notifications also ignore the “Do Not Disturb” mode on the phone.
I will not be reverse engineering the Ingress mobile app, so I also need a convenient way to manually send HTTP requests to the “Daily Hack” check when I’m returning home from playing. I’ve found the HTTP Shortcuts Android app and its home screen widget useful for that.
Tap on “Daily Hack” and the HTTP Shortcuts app fires off an HTTP request to Healthchecks.io
I also bought an AWS IoT button and stuck it on the inside of my apartment’s front door. When passing the door, I can press the button, which triggers a Lambda function, which then pings Healthchecks.io. Here is a quick demonstration. In practice, I am using the phone’s home screen widget most of the time, but this was a good excuse to play around with the AWS IoT button.
And that is all! Whenever 20 hours pass without a ping to Healthchecks.io, my phone then sounds notifications every 5 minutes. At this point, I still have 4 hours left to go out and hack a portal. I don’t silence the notifications until the hack is done–just to be safe and stay “motivated” by the annoying notifications. This setup has been working well for me so far. My current hacking streak is 201 days and counting. Fingers crossed!
Do you also have found an unconventional or creative use for Healthchecks.io? Please let me know via Twitter or email!
If your Healthchecks account is growing and is getting a little hard to manage, Healthchecks.io has a new feature for you: Projects. Use Projects to organize your monitoring dashboards, to have finer-grained team and API access controls, and to simplify your check-integration mapping.
You start will all your existing checks in your default project. You can create more projects and move your existing checks between them. There is no limit to the number of projects you can have. However, your account-level check limit is shared by the projects you own. For example, if you are on the Hobbyist plan (free, 20 check limit) and have three projects, the total number of checks across all three projects must not exceed 20.
Overview of Your Projects
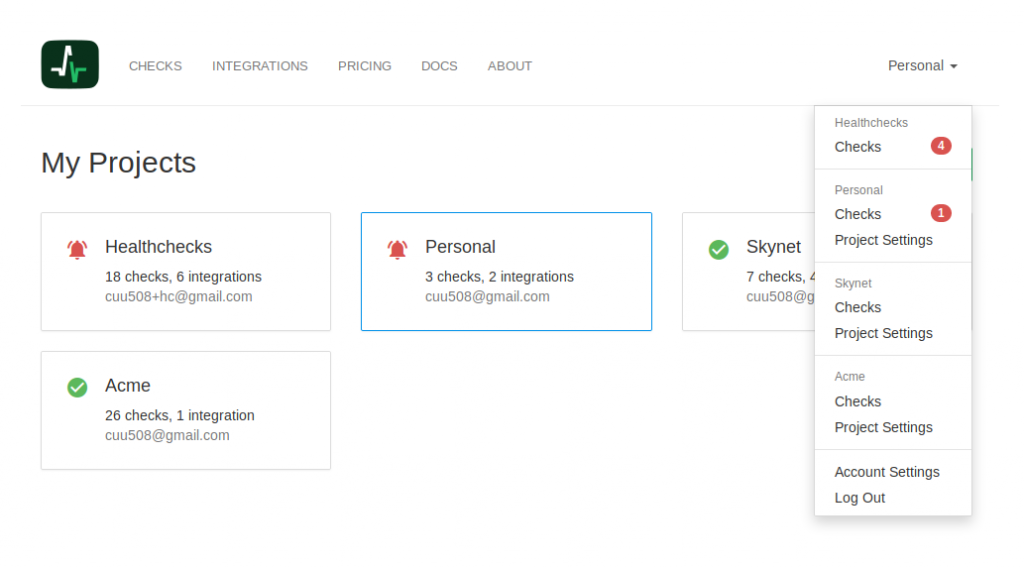
Click on the Healthchecks.io logo in top navigation to see an overview of your projects. You can also use the drop-down menu in the top navigation to switch between projects and to access the “Project Settings” pages. The red badges show the number of checks currently down:
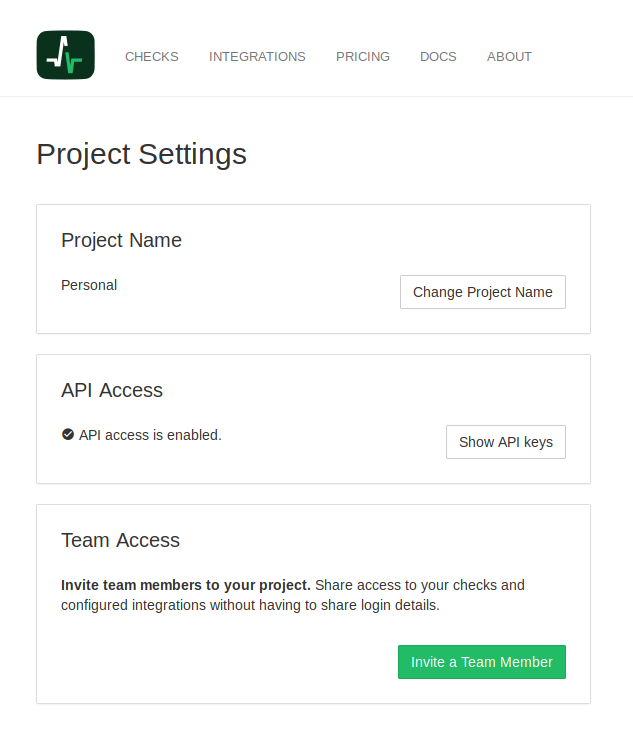
Project Settings
API keys and team memberships are now project-scoped. In the “Project Settings” page you can generate the API keys and invite people to the project’s team. The “Project Settings” page is currently only available to the project owner.
Transferring Checks Between Projects
You can move checks between the projects you have access to. For example, you can create a check in your personal account, but later decide to move it to your company account. The check’s URL and ping history is preserved, but the enabled integrations change: the check loses its current integrations, and gets assigned all integrations of the new project.
This is the initial release of Projects. I will appreciate any and all feedback as I keep iterating on the interface and the features.