I am currently trialing pgmetrics and pgDash for monitoring PostgreSQL databases. Here are my notes on it.
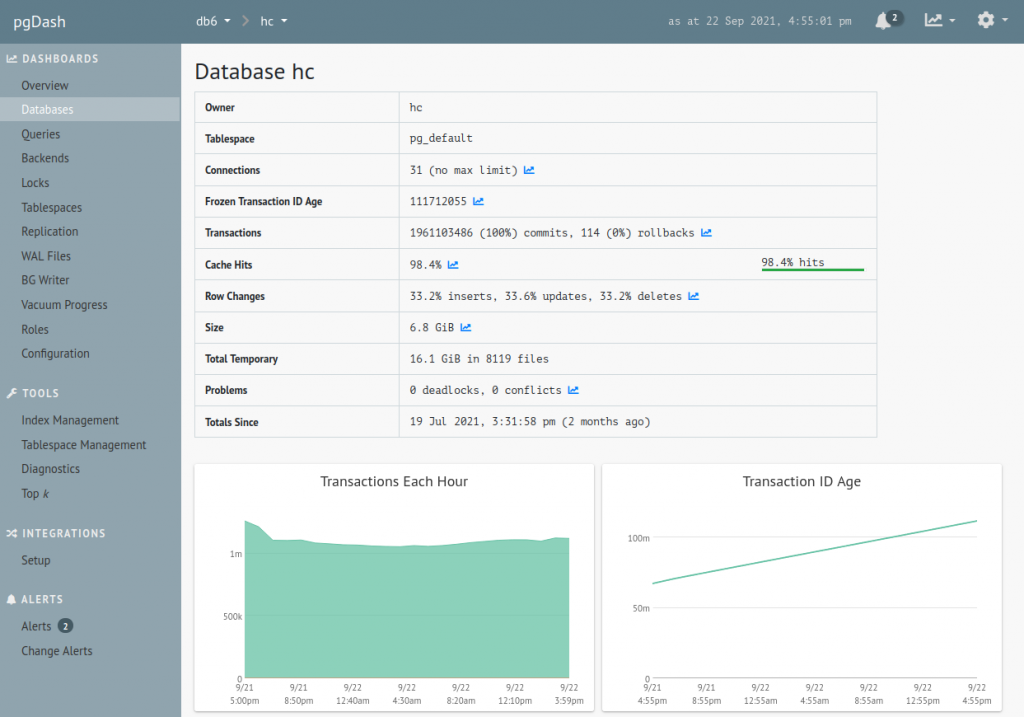
pgmetrics is a command-line tool you point at a PostgreSQL cluster and it spits out statistics and diagnostics in a text or JSON format. It is a standalone binary written in Go, and it is open source. Here is a sample pgmetrics report.
RapidLoop, the company that develops pgmetrics, also runs pgDash – a web service that collects reports generated by pgmetrics and displays them in a web UI. pgDash is a hosted web service and has a monthly cost.
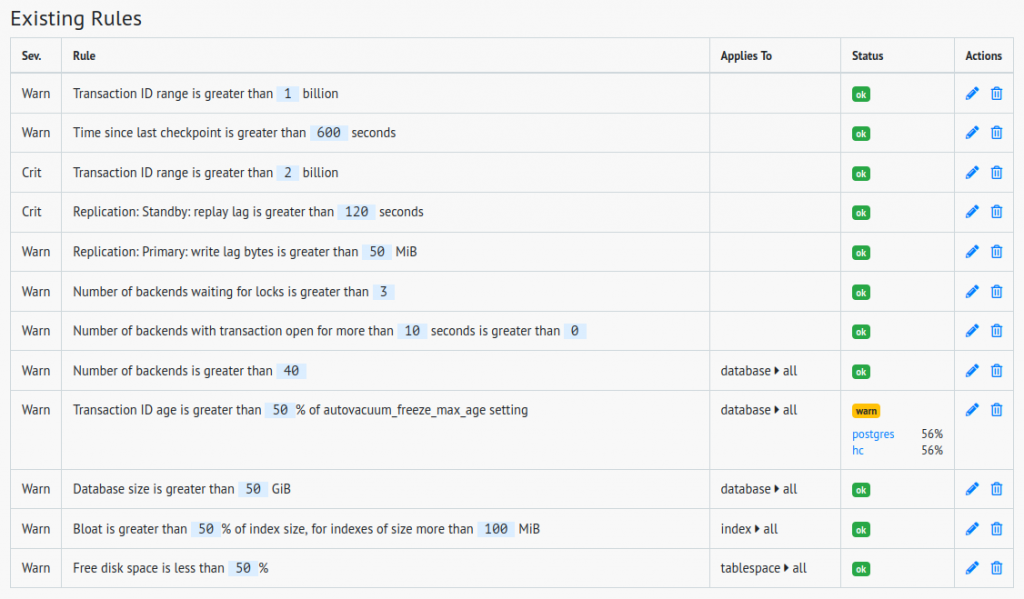
pgDash also supports alerting. For an idea of the types of alerting rules pgDash supports, here are the rules I have currently set up. This is my first go at it, the rules will likely need tweaking:
First Steps
Here’s how you run pgmetrics:
pgmetrics --no-password <dbname>This produces a neatly formatted plain text report. To produce output in JSON format, add “-f json”:
pgmetrics --no-password -f json <dbname>Note: I’m running pgmetrics on the database host as the “postgres” system user. pgmetrics can also connect to the database over the network. If you specify the <dbname> parameter, pgmetrics will return detailed statistics about every table for the specified database. This parameter is optional, and you can also use it multiple times:
pgmetrics --no-password -f json first_database second_databaseThe next task is to submit the pgmetrics output to the pgDash API. pgDash provides a CLI tool “pgdash” for submitting the reports to their API. pgmetrics output can be piped straight into it:
pgmetrics --no-password -f json <dbname> \
| pgdash -a <api-key> report <server-name>
Tangent: Use curl Instead of pgdash
Assuming the “pgdash” tool just POSTs the report to an HTTP API, would it be possible to replace it with curl? I contacted pgDash support with this question. Their answer – it is not officially supported, but yes, it can be done. The pgDash API endpoint is https://app.pgdash.io/api/v1/report, and it expects the payload in the following form:
{"api_key": "<api-key>",
 "server": "<server-name>",
 "data": <the JSON document generated by pgmetrics>}
I used the jq utility to prepare payload in the required format, and then used curl to submit it:
pgmetrics --no-password -f json <dbname> \
| jq '{"apikey":"<api-key>", "server":"<server-name>", "data": .}' \
| curl -d @- https://app.pgdash.io/api/v1/report
I also added request body compression:
pgmetrics --no-password -f json <dbname> \
| jq '{"apikey":"<api-key>", "server":"<server-name>", "data": .}' \
| gzip \
| curl --data-binary @- -H "Content-Encoding: gzip" https://app.pgdash.io/api/v1/report
The next step would have been to add curl parameters for retries and timeout, but my hack was starting to look too much like a hack, so I switched back to the pgdash CLI tool (which is open-source, by the way).
Cron
So far, I had assembled a command that collects database metrics, and submits them to pgDash. Here it is again:
pgmetrics --no-password -f json <dbname> \
| pgdash -a <api-key> report <server-name>
Next, I wanted to run this automatically, on regular schedule. The obvious way to do that is a cron job. Logged in as the “postgres” system user, I ran “crontab -e” and added this line in the editor window (replacing the <dbname>, <api-keys> and <server-name> placeholders with the actual values, of course):
*/5 * * * * /usr/local/bin/pgmetrics --no-password -f json <dbname> | /usr/local/bin/pgdash -a <api-key> report <server-name>Note: cron doesn’t support line continuations with “\”, so the entire command has to be a single line.
On my system, the “pgmetrics” and “pgdash” binaries are in /usr/local/bin. I added /usr/local/bin to cron’s PATH, which let me clean up the command a little:
PATH=/bin:/usr/bin:/usr/local/bin
*/5 * * * * pgmetrics --no-password -f json <dbname> | pgdash -a <api-key> report <server-name>
With this in place, the pgDash web service was getting a fresh report every 5 minutes. But what would happen if the cron job somehow broke? Would pgDash detect the absence of new reports, would it alert me about it? I asked pgDash support about this too, and the answer is no. The suggested solution is to use an external tool to monitor the cron job execution. No worries – as it happens, I have just the tool for this! Let’s add Healthchecks.io to the mix.
How to Watch the Watchmen
The easiest way to set up monitoring for a cron job is to create a new Check in Healthchecks.io, copy its ping URL, and add a curl call to the copied URL at the end of the normal cron command.
In the following example I am using line continuations for readability, but, again, in the actual crontab the command would need to all be on a single line:
PATH=/bin:/usr/bin:/usr/local/bin
*/5 * * * * pgmetrics --no-password -f json <db-name> \
| pgdash -a <api-key> report <server-name> \
&& curl https://hc-ping.com/<uuid>
Here’s how this works. The final curl call runs only if pgdash exits with exit status 0. curl makes an HTTP GET request to hc-ping.com, and Healthchecks.io registers it as a “success” signal. As long as the success signals arrive on schedule, Healthchecks.io stays quiet. When a success signal doesn’t arrive on time, Healthchecks.io sends out alerts. This is already functional, but I had a few improvements in mind:
- Measure job execution time by requesting
https://hc-ping.com/<uuid>/startbefore pgmetrics runs - If pgmetrics or pgdash exits with a non-zero exit status, signal a failure by sending a request to
https://hc-ping.com/<uuid>/fail - Capture the command’s output, and send it along with the success or failure signal
- If a request to hc-ping.com fails or times out, retry it a few times
All of this can be done in a shell script, and even in a shell one-liner, but a simpler option is to use runitor:
runitor -uuid <uuid> -- <command goes here>runitor takes care of all of the above – it sends the start signal, it captures stdout and stderr, and it signals success or failure depending on the command’s exit status.
Here’s my cron job, updated to use runitor:
PATH=/bin:/usr/bin:/usr/local/bin
*/5 * * * * runitor -uuid <uuid> -- \
bash -c "pgmetrics --no-password -f json <dbname> | pgdash -a <api-key> report <server-name>"
There’s another thing I wanted to try out: slug URLs. Healthchecks.io supports two ping URL formats:
- uuid format:
https://hc-ping.com/<uuid> - slug format:
https://hc-ping.com/<ping-key>/<slug>
The slug format is a new feature and I wanted to dog-food it here. runitor supports the slug format starting from version v0.9.0-beta.1. It accepts the ping key and the slug via command line parameters like so:
runitor -ping-key <ping-key> -slug <slug> -- <command goes here>Note: my actual database name is “hc”, the server name is “db7”, and the check’s slug is “db7-pgmetrics”. In the remaining code samples, I’ll use these values instead of placeholders. The API keys in the samples are made up though.
Here’s the cron job definition, updated to use slug URLs:
PATH=/bin:/usr/bin:/usr/local/bin
*/5 * * * * runitor -ping-key sC2Tc1MwVVWlpEItz -slug db7-pgmetrics -- \
bash -c "pgmetrics --no-password -f json hc | pgdash -a tFAJJ5L7a4ft-qbqR5JIDA report db7"
One final tweak was to move the keys and the server name to environment variables:
SERVER=db7
PING_KEY=sC2Tc1MwVVWlpEItzY
PGDASH_KEY=tFAJJ5L7a4ft-qbqR5JIDA
PATH=/bin:/usr/bin:/usr/local/bin

*/5 * * * * runitor -ping-key $PING_KEY -slug $SERVER-pgmetrics -- \
bash -c "pgmetrics --no-password -f json hc | pgdash -a $PGDASH_KEY report $SERVER"
This way, the PING_KEY and PGDASH_KEY values don’t get logged to syslog every time the cron job runs. It also looks cleaner.
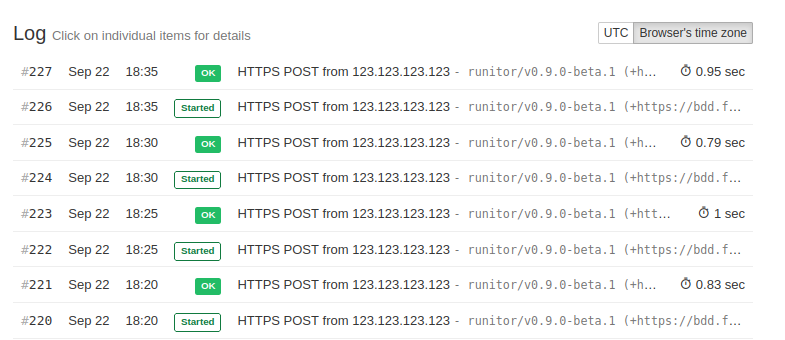
Time to test this setup. In the happy case, where pgmetrics, pgdash, and runitor all run with no issues, Healthchecks.io shows the start and success signal arriving neatly every 5 minutes:
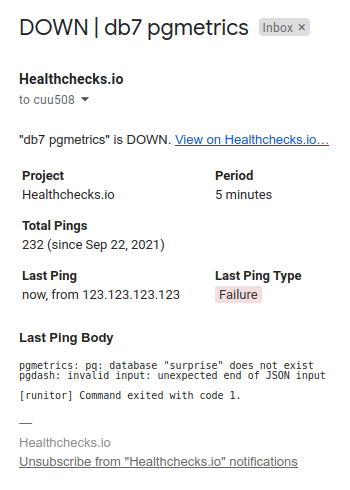
I tested the case where pgmetrics exits with a non-zero exit code. I simulated this by changing the database name to “surprise”, which does not exist. After the next cron job run, I got an email notification from Healthchecks.io:
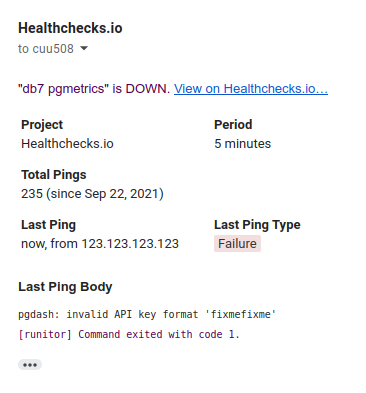
I also tested the case where pgdash fails. I simulated this by changing the pgDash API key to an invalid one:
The last thing left to handle was automated provisioning of the cron job.
Automated Provisioning
The next time I set up a new database server, I don’t want to copy binaries and edit crontab by hand. I want this automated. First, here’s my template for the cron job:
SERVER=%(HOSTNAME)s
PING_KEY=%(PING_KEY)s
PGDASH_KEY=%(PGDASH_KEY)s
PATH=/bin:/usr/bin:/usr/local/bin

*/5 * * * * runitor -ping-key $PING_KEY -slug $SERVER-pgmetrics -- bash -c "pgmetrics --no-password -f json hc | pgdash -a $PGDASH_KEY report $SERVER"
And here’s the Fabric task which uploads binaries and installs the cron job on the remote server:
def pgdash():
    # this loads secrets from an encrypted file
    # into a global variable env.vault
    require_vault()

    # this uploads the binary executables.
    # cannot use f-strings here because Fabric 1.x uses Python 2.7 (yep)
    # the require.file command comes from a helper library, fabtools
    for name in ["pgdash", "pgmetrics", "runitor"]:
        require.file("/usr/local/bin/" + name, source="files/" + name, mode="755")

    ctx = {"HOSTNAME": get_hostname()}
    ctx.update(env.vault)

    # read and fill out the template, upload it to a temporary
    # file on the remote server
    require.files.template_file(
        "/tmp/postgres-crontab",
        template_source="files/postgres-crontab.tmpl",
        context=ctx,
    )

    # install the crontab and delete the temporary file
    sudo("crontab /tmp/postgres-crontab", user="postgres")
    run("rm /tmp/postgres-crontab")
One interesting thing here is how the cron job definition gets installed. When I set up a new cron job interactively, I run “crontab -e” and a text editor opens. I type or paste the new job, save, and exit the editor. This method would be hard to automate, but there is an automation-friendly way:
crontab <filename>This replaces the current user’s existing cron jobs with whatever is in the file referenced by <filename>. Nice and simple!
I now have continuous pgDash monitoring set up for Healthchecks.io primary and standby database servers. I can look at the reported data and see which indexes are bloated, how far away is the transaction ID exhaustion event, which Postgres configuration settings need tuning, and all that good stuff. Thanks for reading and happy monitoring!